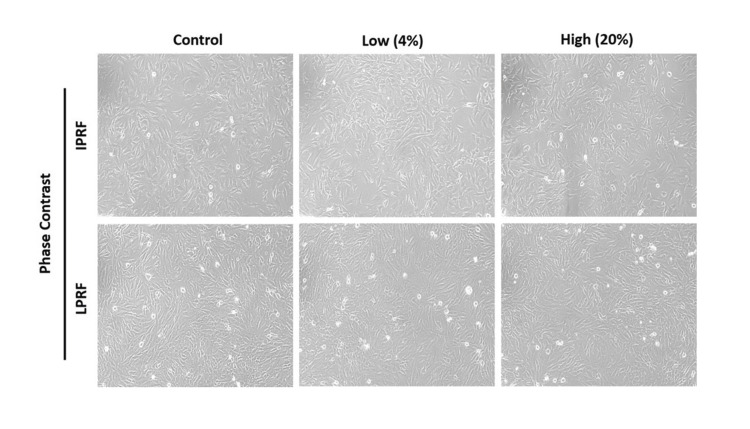
Figure 1. Morphological evaluation using phase contrast microscopy: The biocompatibility of L-PRF and I-PRF, induced by both low (4%) and high (20%) concentrations, was evaluated in comparison with a control group on MG-63 osteoblast-like cells. This assessment was conducted using both phase contrast and fluorescent microscopy. Magnification: 20X.
L-PRF: Leukocyte-Platelet-Rich Fibrin, I-PRF: Injectable Platelet-Rich Fibrin.

