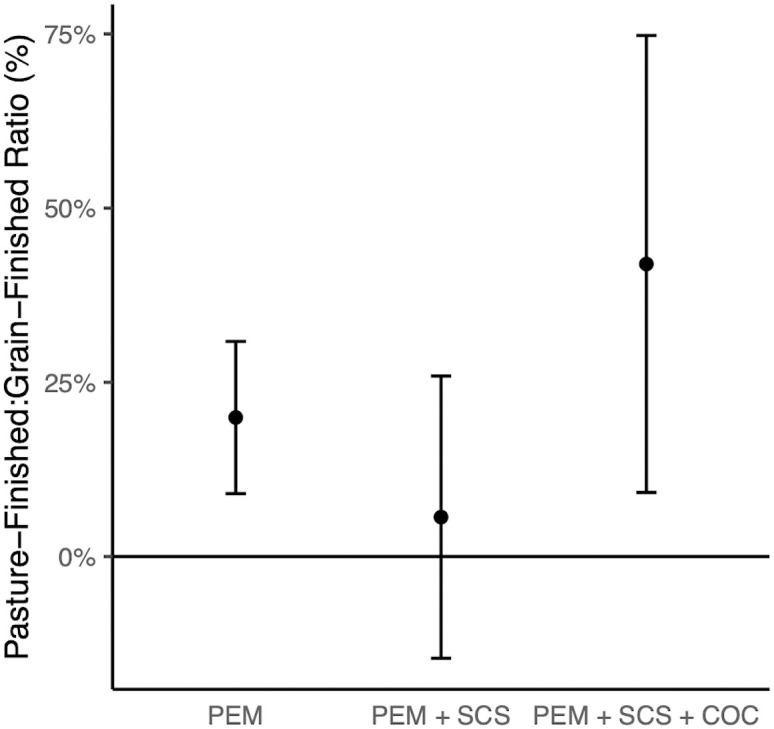
Fig 1. Average ratios of carbon footprints between pasture-finished and grain-finished.

Ratios expressed as percentage difference. PEM denotes production emissions, SCS denotes soil carbon sequestration, and COC denotes carbon opportunity cost. Values above (below) 0 denote the carbon footprint for pasture-finished operations is larger (smaller) than for grain-finished operations. Comparisons were made within paired production systems to control for agronomic and environmental differences. Bars show means and 95% confidence intervals. On average, carbon footprints for pasture-finished operations are significantly greater (p<0.01) than those of grain-finished operations when only production emissions are included and when production emissions, soil carbon sequestration and carbon opportunity cost are included. n = 20 pairs.
