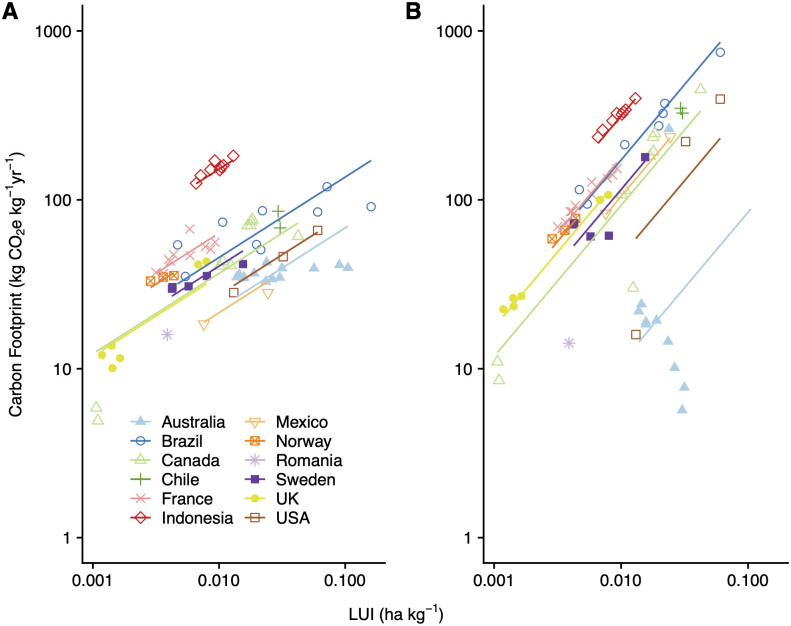
Fig 2. The relationship between land-use intensity and carbon footprint of beef production systems.
Results from a regression of log(carbon footprint) on log(land-use intensity) with country random effects. Dots indicate life-cycle assessment observations; colors indicate countries; and lines represent the slope of the regression that includes all countries, adjusted according to the levels of each country. A) Carbon footprint including only production emissions. n = 72. B) Carbon footprint including production emissions, soil carbon sequestration and carbon opportunity cost. n = 69.

