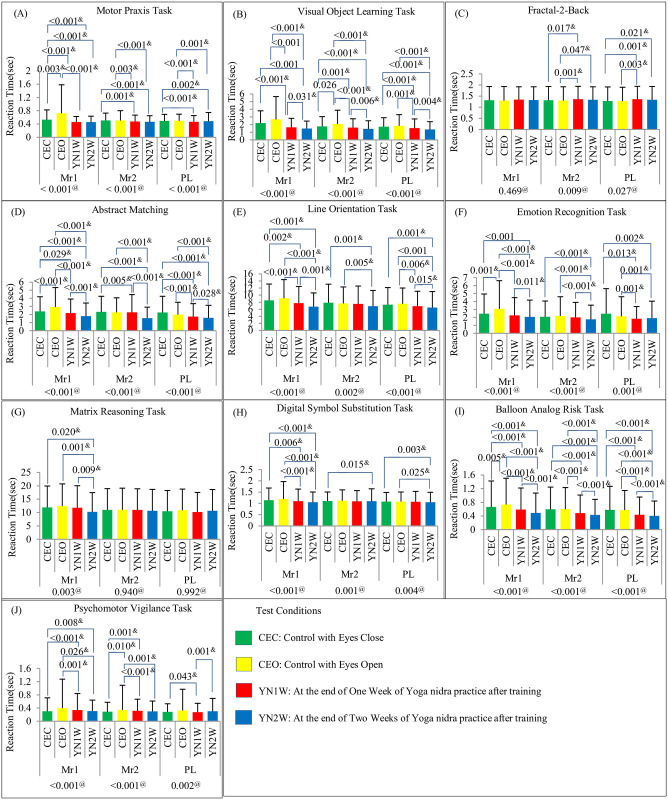
Fig 4. Cognitive Testing Battery Results Showing Reaction Time (Mean (SD)) in (A)MPT, (B)VOLT, (C)NBACK, (DIM, (E)LOT, (F)ERT, (G)MRT, (H)DSST, (I)BART, and (J)PVT with Test Condition Wise Comparison.
(Comparison model for test condition i.e. CEC, CEO, YN1W, and YN2W is shown below each time i.e. Mr1, Mr2, and PL. Significant post-hoc p-values are also depicted). #: One-Way Repeated Measure (RM) Analysis of Variance (ANOVA) p-values $: Post-hoc analysis (pairwise comparison) is done using paired t-test with Bonferroni correction (significant changes indicated by p-values given above the bars). @: Friedman’s test p-value (if data is not normally distributed) &: Post-hoc analysis (pairwise comparison) is done using Wilcoxon Signed-Rank test with Bonferroni correction (significant changes indicated by p-values given above the bars). Mr1: Test just before CEC, CEO, YN1W or YN2W; Mr2: Tests conducted just after CEO, C EC, YN1W or YN2W; PL: Test conducted after the lunch.

