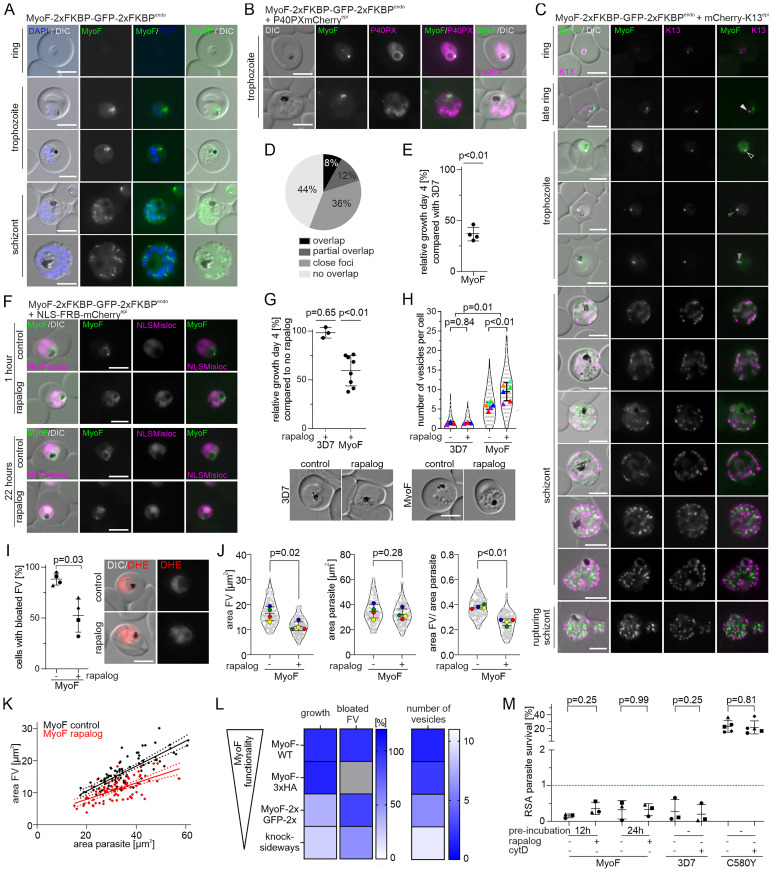
Fig 1. MyoF is involved in host cell cytosol uptake and associated with the K13 compartment.
(A) Localisation of MyoF-2xFKBP-GFP-2xFKBP expressed from the endogenous locus by live-cell microscopy across the intra-erythrocytic development cycle. Nuclei were stained with DAPI. Scale bar, 5 μm. (B) Live cell microscopy images of parasites expressing the MyoF-2xFKBP-GFP-2xFKBP fusion protein with an episomally expressed FV marker P40PX-mCherry. Scale bar, 5 μm. (C) Live cell microscopy images of parasites expressing the MyoF-2xFKBP-GFP-2xFKBP fusion protein with episomally expressed mCherry-K13. Scale bar, 5 μm. Arrows indicate categories from Fig 1D. (D) Foci were categorized into ‘overlap’ (black), ‘partial overlap’ (dark grey), ‘close foci’ (= less than one focus radius apart) (grey) and ‘non overlap’ (light grey). Three independent live microscopy sessions with each n = 14 analysed parasites. (E) Relative growth of synchronised MyoF-2xFKBP-GFP-2xFKBPendo compared with 3D7 wild type parasites after two growth cycles. Each dot shows one of four independent growth experiments. P-values determined by one-sample t-test. (F) Live-cell microscopy of knock sideways (rapalog) and control MyoF-2xFKBP-GFP-2xFKBPendo+1xNLSmislocaliser parasites 1 hour or 22 hours after the induction by addition of rapalog. Scale bar, 5 μm. (G) Relative growth of asynchronous 3D7 and asynchronous MyoF-2xFKBP-GFP-2xFKBPendo+1xNLSmislocaliser parasites (+ rapalog) compared with the corresponding control parasites (without rapalog) after five days. Three (3D7) and eight (MyoF-2xFKBP-GFP-2xFKBPendo) independent experiments (individual experiments shown in S2D Fig). Error bars, mean ± SD. P-values determined by Welch’s t-test. (H) Number of vesicles per parasite in trophozoites determined by live-cell fluorescence microscopy (DIC) in 3D7 and MyoF-2xFKBP-GFP-2xFKBPendo+1xNLSmislocaliser parasites with and without rapalog addition. Three (3D7) and six (MyoF-2xFKBP-GFP-2xFKBPendo+1xNLSmislocaliser) independent experiments with each time n = 16–25 (mean 20.9) parasites analysed per condition. Mean of each independent experiment indicated by coloured triangle, individual datapoints by grey dots. Data presented according to SuperPlot guidelines [147]; error bars represent mean ± SD. P-value for ± rapalog determined by paired t-test and for 3D7 vs MyoF by Mann-Whitney. Representative DIC images are displayed below. (I) Bloated food vacuole assay with MyoF-2xFKBP-GFP-2xFKBPendo parasites 8 hours after inactivation of MyoF (+ rapalog) compared with controls (- rapalog). Cells were categorized as with ‘bloated FV’ or ‘non-bloated FV’ and percentage of cells with bloated FV is displayed; n = 4 independent experiments with each n = 33–40 (mean 34.6) parasites analysed per condition. P-values determined by Welch’s t-test. Representative DIC and fluorescence microscopy images shown on the right. Parasite cytoplasm was visualized with DHE. Experimental setup shown in S2G Fig. (J) Area of the FV, area of the parasite and area of FV divided by area of the corresponding parasite of MyoF-2xFKBP-GFP-2xFKBPendo+1xNLSmislocaliser parasites analysed in Fig 1I. Mean of each independent experiment indicated by coloured dots, individual data points by grey dots. Data presented according to SuperPlot guidelines [147]; error bars represent mean ± SD. P-value determined by paired t-test. Representative DIC and fluorescence microscopy images are shown in the S2J Fig. (K) Area of FV of individual cells plotted versus the area of the corresponding parasite in MyoF-2xFKBP-GFP-2xFKBPendo+1xNLSmislocaliser parasites of the experiments shown in Fig 1H-I. Line represents linear regression with error indicated by dashed line. (L) Summary heatmap showing the effect of C-terminal tagging with 3xHA or 2xFKBP-GFP-2xFKBP and knock-sideways on MyoF functionality depicted as growth [%], bloated FV [%] and number of induced vesicles. (M) Parasite survival rate (% survival compared to control without DHA) 66 h after 6 h DHA (700 nM) treatment in standard RSA. MyoF-2xFKBP-GFP-2xFKBPendo parasites + 1xNLSmislocaliser were pre-treated with rapalog either 12 or 24 hours prior to the assay. Three independent experiments, P-value determined by Wilcoxon test. Green dashed line indicates 1% ART resistance cut-off [26]. 2988–8392 (mean 5102) cells for control and 22704–44038 (mean 32077) cells for DHA treated samples were counted. Experimental setup shown in S2K Fig. 3D7 and 3D7-K13C580Y [29] parasites were incubated with CytochalasinD for 6h in parallel with DHA pulse. 850–13180 (mean 4677) cells for control and 1065–38515 (mean 15532) cells for DHA treated samples were counted. Three (3D7) or five (3D7-K13C580Y) independent experiments, P-value determined by Wilcoxon test.

