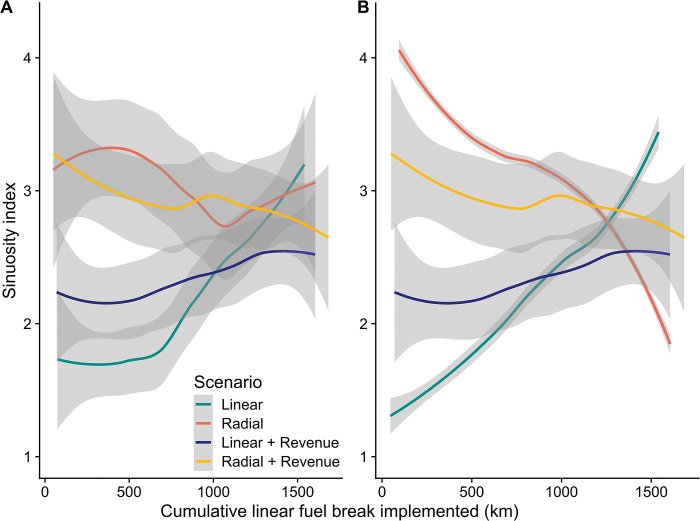
Fig 7. Scenario sinuosity results.
A) Model outputs showing fuel break project sinuosity as successive projects are implemented for alternative geometries, and combined geometry and revenue directly from the ForSys model. Outputs are smoothed with a loess function with a span = 0.75 [57]. Unsmoothed figure version in Fig S2.4 in S2 Appendix B. B) Same as A after sorting the population of geometry-only projects (Scenarios 1 and 3, Table 1) based on the sinuosity variable to simulate an ordinal implementation based on geometry objectives. The latter sequence was adopted to simulate project implementation scenarios and analyze responses. Note that mixed-objective projects were not sorted based on sinuosity.

