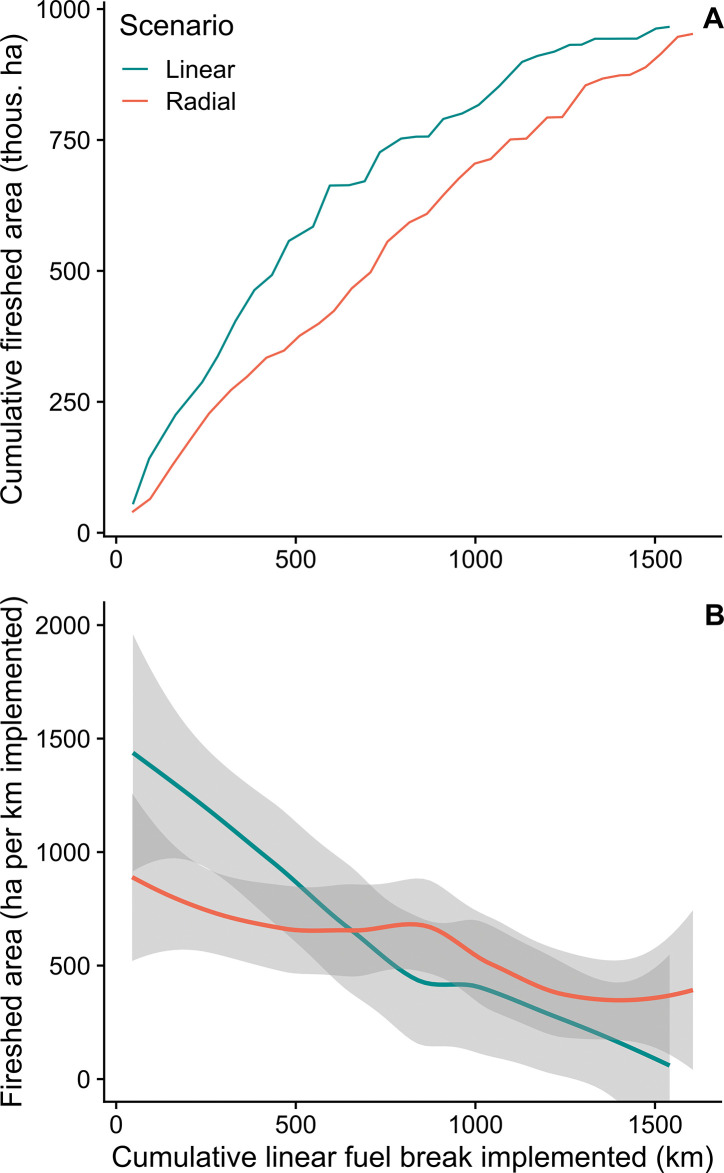
Fig 9. Fuel break fireshed effects.
A) Cumulative area within a fuel break fireshed with increasing length of fuel breaks implemented for alternative project geometries, linear versus radial. The graph shows that for a given distance treated, linear fuel break projects have firesheds that cover more area, meaning that more fires are intercepted. The graph also shows declining addition of fireshed area when about half of the FBN is treated (1,000 km). B) Efficiency of fuel break length on fireshed area for the two geometry scenarios showing the incremental increase in fireshed area as projects are implemented. Outputs are smoothed with a loess function with a span = 0.75 [57]. See Fig 6 for definition of firesheds.

