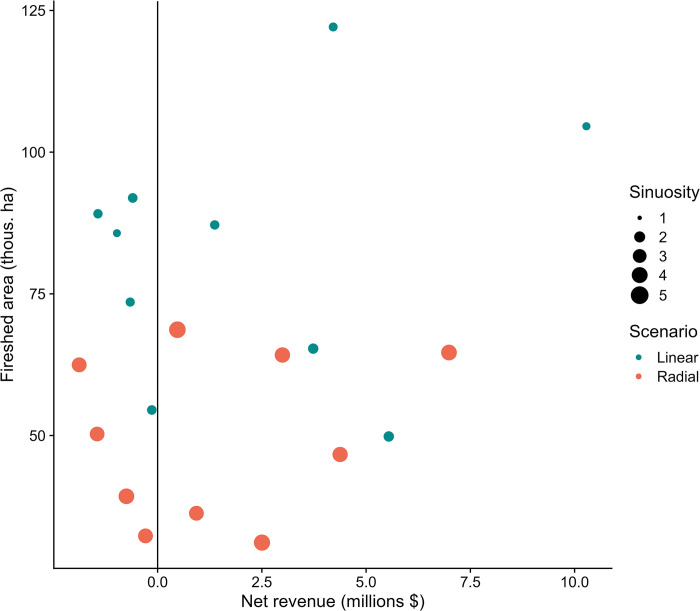
Fig 11. Scatter plot of fireshed area against projected net revenue from forest management per project for the linear and radial scenarios.
Data are shown for 10 projects for each scenario that best achieved the desired geometry, linear versus radial, based on sinuosity. Sinuosity index illustrated in Fig 5. Fireshed area is estimated independently for each project rather than cumulatively as shown in Fig 9. See Fig 6 for definition of fuel break firesheds.

