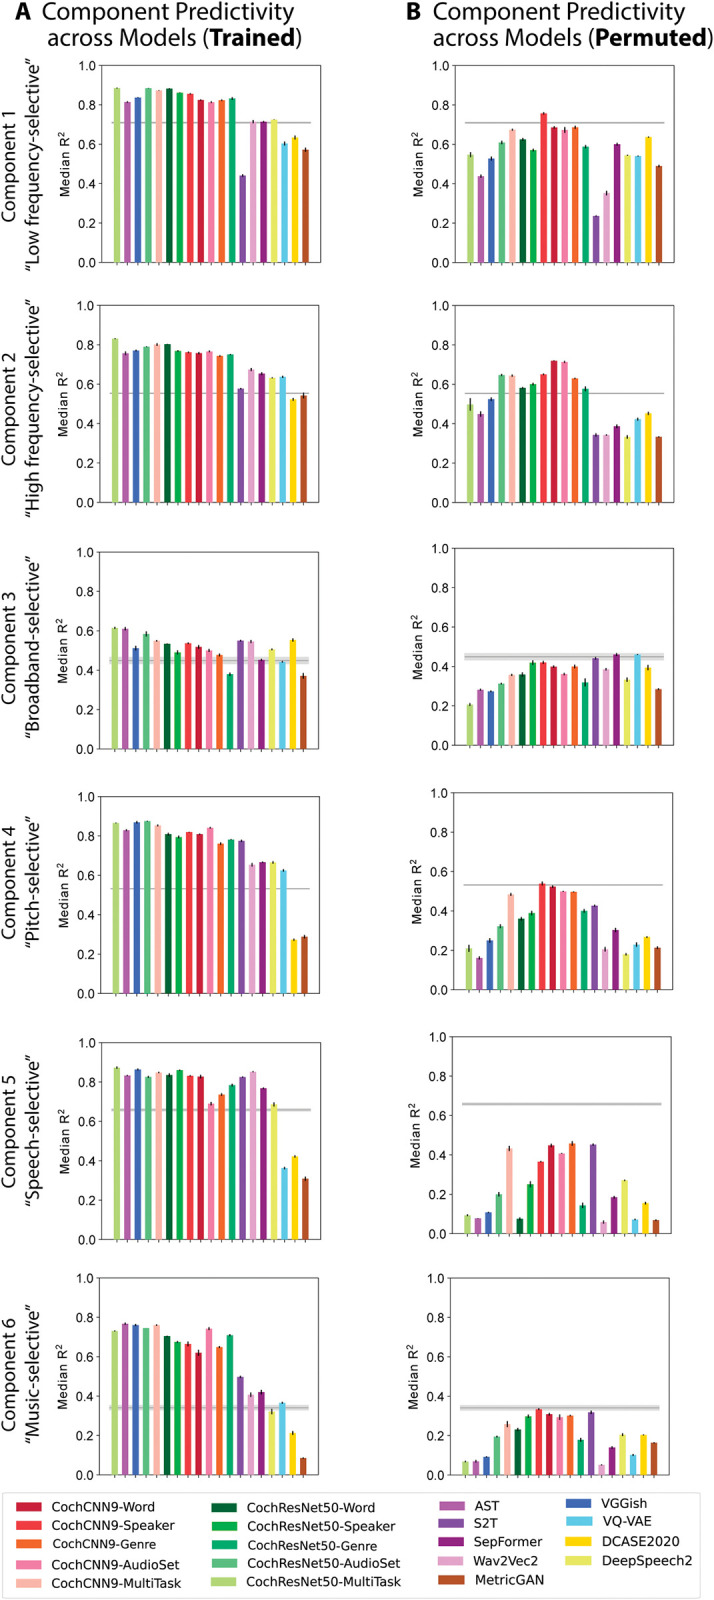
Fig 5. Summary of model predictions of fMRI response components.

(A) Component response variance explained by each of the trained models. Model ordering is the same as that in Fig 2A for ease of comparison. Variance explained was obtained from the best-predicting stage of each model for each component, selected using independent data. Error bars are SEM over iterations of the model stage selection procedure (see Methods; Component modeling). See S3 Fig for a comparison of results for models trained with different random seeds (results were overall similar for different seeds). (B) Component response variation explained by each of the permuted models. The trained models (both in-house and external), but not the permuted models, tend to outpredict the SpectroTemporal baseline for all components, but the effect is most pronounced for components 4–6. Data and code with which to reproduce results are available at https://github.com/gretatuckute/auditory_brain_dnn.
