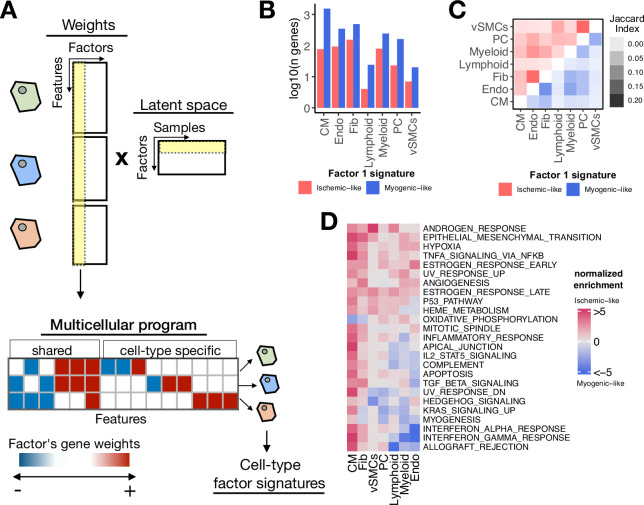
Figure 3. Multicellular programs associated with myocardial remodeling.
(A) Each factor forming the latent space reconstructed by multicellular factor analysis when applied to single-cell data can be interpreted as a higher-level representation of coordinated molecular processes across cell types, here referred to as multicellular programs. The specific cell-type signatures from these programs can be recovered from the feature weights across cell types, where the expression changes of one cell type relate to the other. Moreover, since each multicellular program associates with the variability of samples (e.g. differentially active across conditions), cell-type signatures can also be interpreted in the same context. (B) Log10(number of genes) for each cell-type Factor 1 signature associated with the sample conditions of the human myocardial infarction data. Signatures were divided into ischemic-like or myogenic-like signatures based on the weight of each gene. (C) Jaccard index across myogenic-like (upper triangle) and ischemic-like (lower triangle) cell-type factor signatures associated with the sample conditions of the human myocardial infarction data. (D) Functional enrichment of MSigDB’s hallmarks in cell-type signatures. Enrichment is quantified as normalized weighted means, using the gene weights of each cell-type signature. Top 25 pathways based on mean absolute enrichment score are shown.


