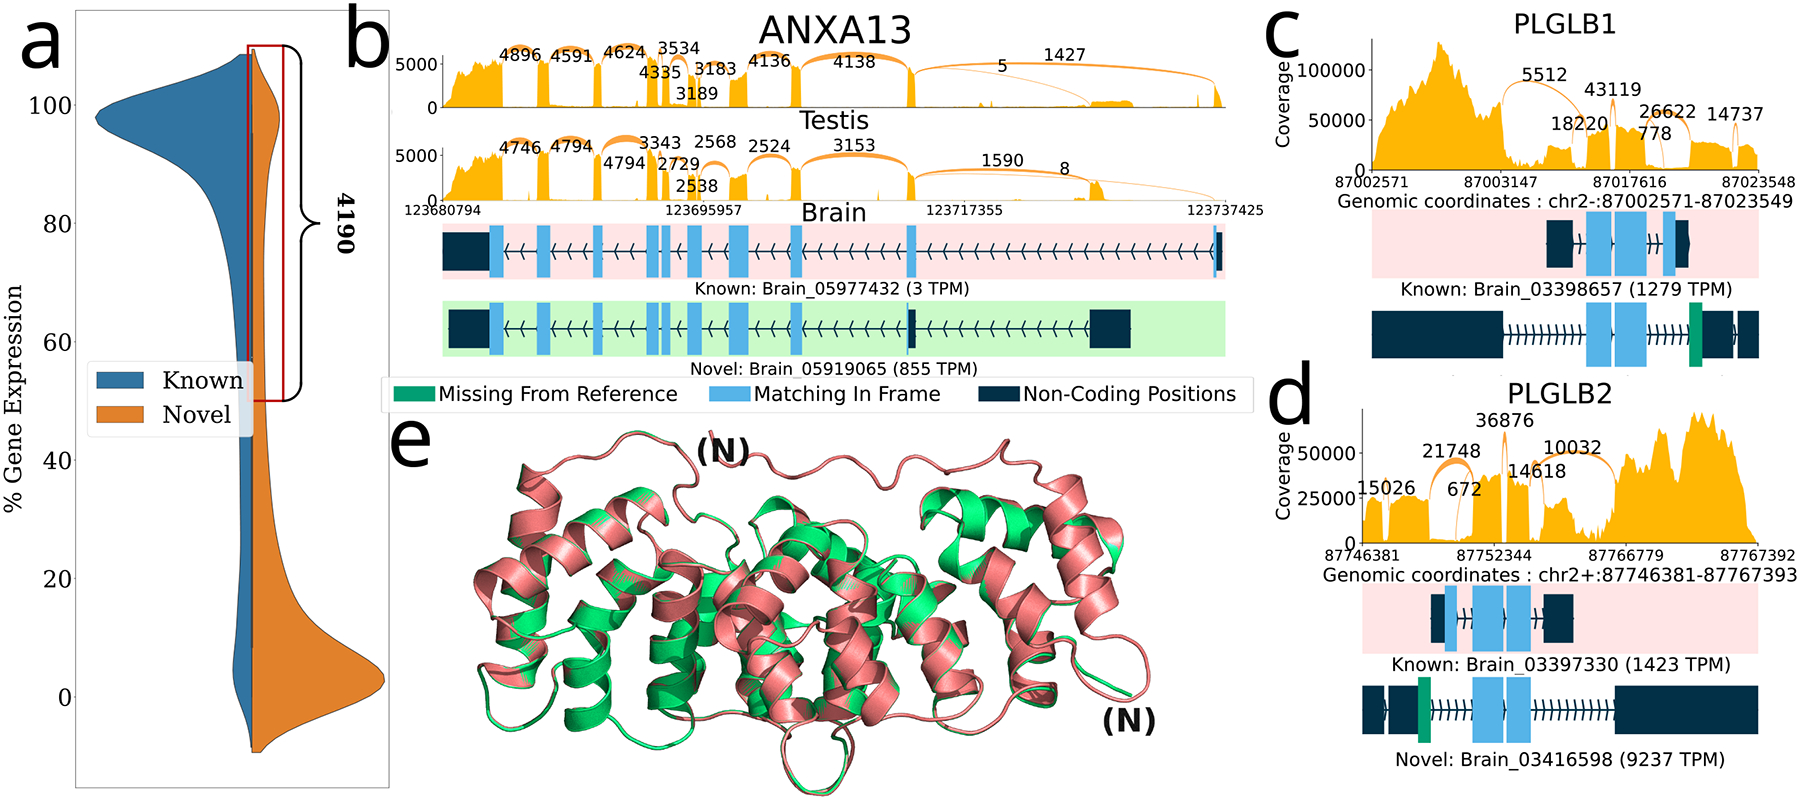
Figure 3.

Novel ORFs in the GTEx dataset inferred using ORFanage. a) Overall distribution of loci by percent gene expression (y-axis) that comes from novel (orange) and known (blue) transcripts and a zoomed-in view of the region containing 4,190 loci where >=50% of the total expression comes from transcripts with novel ORFs or novel transcripts without an ORF. b,c,d) Sashimi plots illustrating selected examples of novel ORFs that were identified by ORFanage, each depicting a different type of variation. In each plot, coverage and splice junction values are cumulative across all samples60. The uppermost transcript, highlighted with a pink background, shows the MANE annotation. Expression levels measured in TPM are shown for each transcript. b) An alternative 5’ exon in ANXA13 that changes the start codon and shortens the ORF. e) The 3D alignment of the MANE protein (pink) to the novel ORF (green) computed by Alphafold2 and visualized via PyMOL70 is shown below with the N-termini labeled for each. c,d) Two plots show similar novel ORFs for two paralogous genes PLGLB1 and PLGB2, where skipping of the 1st reference coding exon is effectively offset by the introduction of an upstream novel exon with an alternative start codon.
