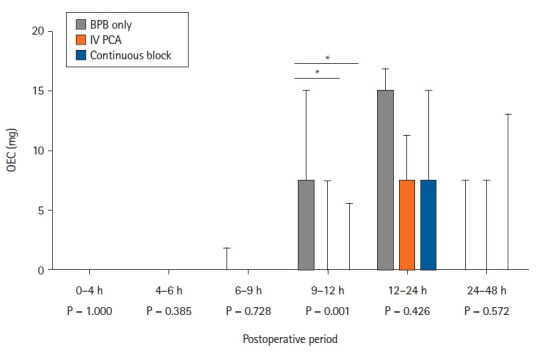
Fig. 3.

Box plot showing the oral OEC in the 48 h postoperative period for 66 patients randomized to the following groups: BPB (BPB only group), single infraclavicular BPB with intravenous patient-controlled analgesia IV PCA (IV PCA group), and single infraclavicular BPB with continuous infraclavicular BPB (continuous block group). BPB: brachial plexus block, IV PCA: intravenous patient-controlled analgesia, OEC: opioid equivalent consumption. The horizontal bar indicates the median, and the upper bound indicates the third quartile. *P < 0.017.
