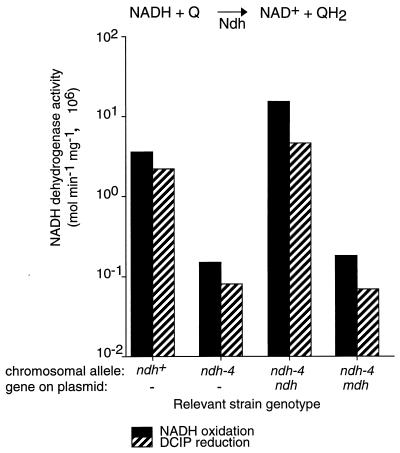
FIG. 3.
Comparison of NADH dehydrogenase activities in the INHs parent strain, the INHr ndh-4 mutant, and the ndh-4 mutant complemented by the ndh and mdh genes. For each strain, the chromosomal allele and the plasmid-borne gene are indicated below the horizontal axis. The rate of NADH oxidation was measured with menadione as an electron acceptor (solid black bars). The rate of NADH-dependent DCIP reduction is represented by bars with diagonal stripes. Cultures were grown at 30°C, and assays were performed at room temperature. Membrane fractions were used for these assays; reaction conditions are described in Materials and Methods. The error (standard deviation) is less than 10% for all data points and is not shown.

