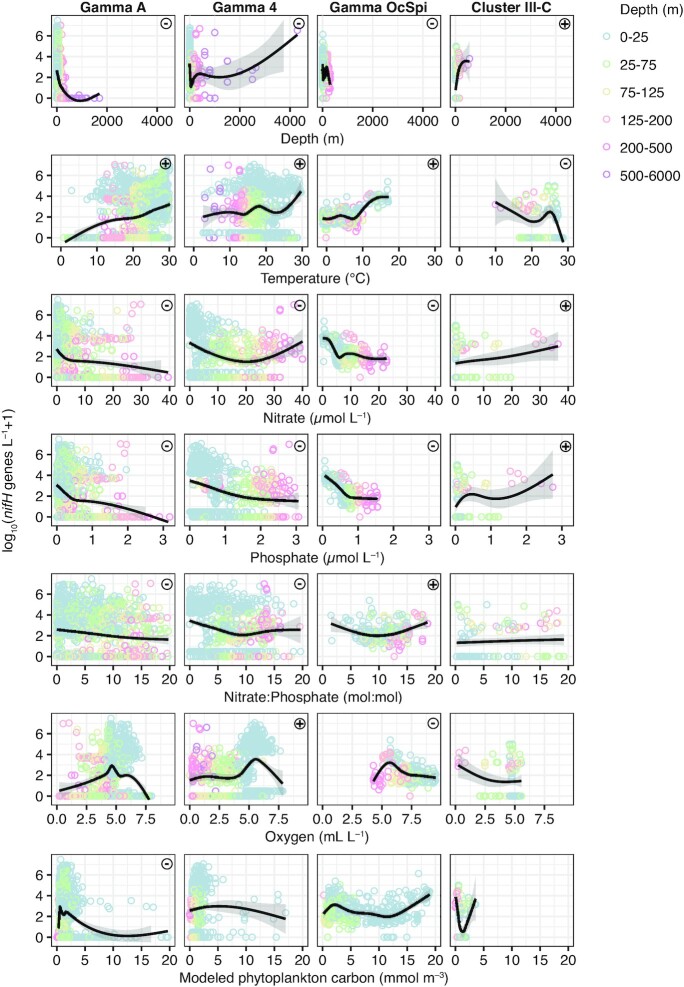
Figure 4.
Environmental predictors vary among NCD taxa. NCD nifH gene abundances are plotted against environmental metadata from World Ocean Atlas monthly climatology (temperature, nitrate, phosphate, N:P, and O2 concentration) and Pisces model output of phytoplankton biomass in units of carbon (modeled phytoplankton C). Tolerances for colocalization are presented in Table S4 (Supporting Information). Each point represents an individual nifH gene abundance sample, with sample depth shown in color. Note that a small fraction of data with outlying x-axis values were excluded from plots. Black lines and gray shading represent the smoothed conditional mean and 95% confidence intervals. Symbols (+/-) reflect positive and negative correlations (Spearman rank with Bonferroni correction for 28 comparisons).

