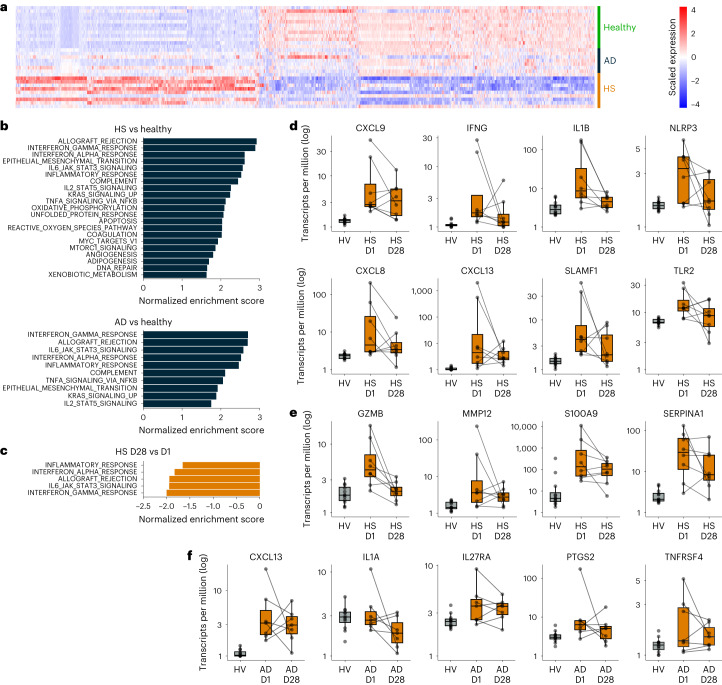
Fig. 3. RNA-seq analysis of skin lesion biopsies in patients with HS (n = 8) or AD (n = 7) taken before and after KT-474 treatment compared to HV skin (n = 12).
a, Heat map showing differentially expressed genes (FDR q < 0.05, absolute fold change ≥ 2) between HVs from MAD3 and patients with HS and patients with AD pre-treatment. b, Normalized enrichment scores for pathways that were significantly upregulated (FDR q < 0.01) pre-treatment in patients with HS and patients with AD compared to HVs. c, Normalized enrichment scores for pathways that were significantly downregulated (FDR q < 0.01) at day 28 versus day 1 pre-dose in patients with HS. d, Proinflammatory markers at day 1 pre-dose (HS D1) and day 28 (HS D28) in patients with HS with comparison to pre-treatment expression in HVs. e, Complement pathway markers at day 1 pre-dose (HS D1) and day 28 (HS D28) in patients with HS with comparison to pre-treatment expression in HVs. f, Proinflammatory markers at day 1 pre-dose (AD D1) and day 28 (AD D28) in patients with AD with comparison to pre-treatment expression in HVs. In d–f, lines connect measurements from the same patient at day 1 pre-dose and day 28. Boxes show median and interquartile range. The upper whisker extends to the largest value no further than 1.5× interquartile range. The lower whisker extends to the smallest value at most 1.5× interquartile range. MAD3, MAD cohort 3.

