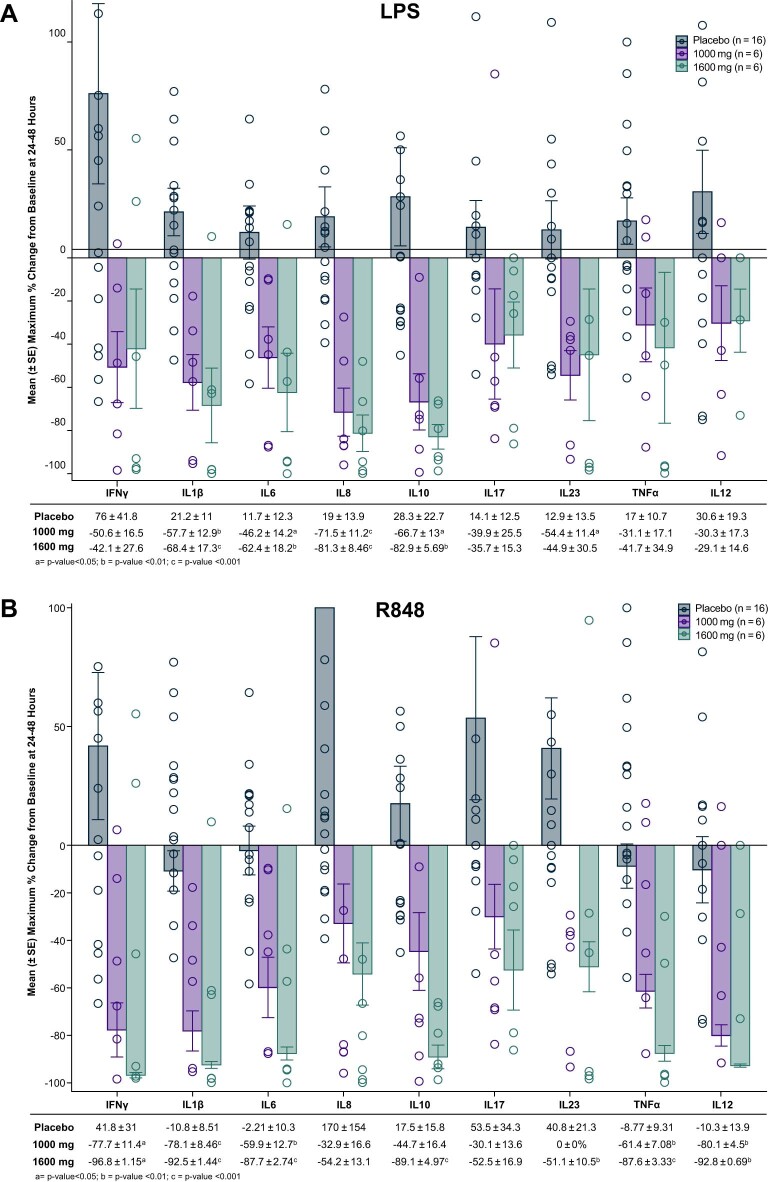
Extended Data Fig. 4. Inhibition of TLR-stimulated ex vivo cytokine production in blood of healthy volunteers treated with a single dose of KT-474.
Maximum change from baseline at 24–48 hours post-dose in cytokine induction by TLR7/8 agonist R848 (a) or TLR4 agonist LPS (b) in healthy volunteers treated with placebo (n = 16), 1000 mg SD (n = 6) and 1600 mg SD (n = 6). Treatment groups were compared to placebo using one-way analysis of variance (ANOVA) models with Tukey correction for multiple comparisons. LPS = lipopolysaccharide; SAD = single ascending dose; SD = single dose; SE = standard error.

