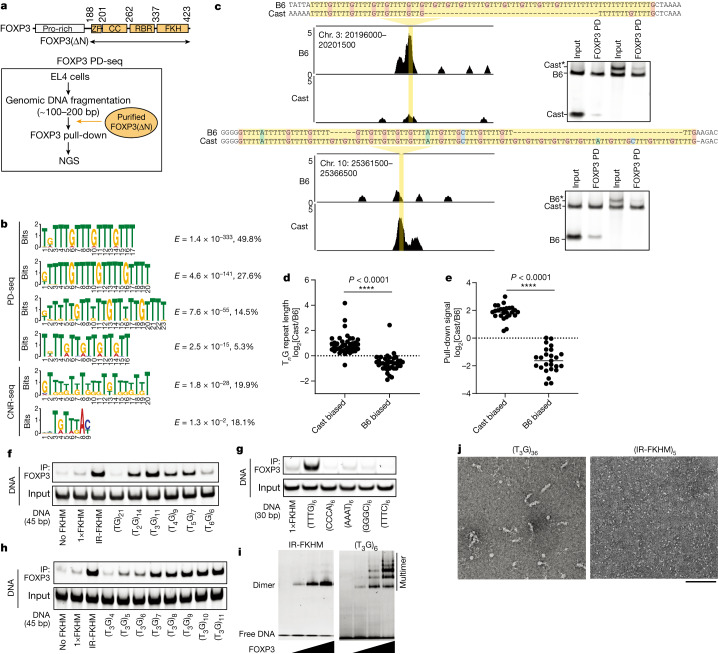
Fig. 1. FOXP3 recognizes TnG repeat microsatellites.
a, The FOXP3 domain architecture and schematic of FOXP3 PD-seq. CC, coiled-coil domain; ZF, zinc finger domain. b, De novo motif analysis of FOXP3 PD-seq peaks (n = 21,605) and CNR-seq peaks14 (n = 6,655) using MEME-ChIP and STREME. The E score and the percentage of peaks containing the given motif are shown on the right. See Supplementary Table 1a,b for the comprehensive list of motifs for PD-seq, CNR-seq12,14 and ChIP–seq data14,23. c, Allelic imbalance in FOXP3 binding in vivo. Left, genome browser view of CNR-seq14, showing B6-biased (top) and Cast-biased (bottom) peaks. B6 genomic coordinates are shown at the top left. Right, B6 and Cast DNA oligos were mixed 1:1 and analysed using FOXP3(∆N) pull-down and gel analysis. Cast* and B6* represent oligos extended with a random sequence (Supplementary Table 2b) to reverse their length bias. Chr., chromosome. d, TnG repeat length comparison between Cast and B6 mice at 76 loci, showing allelic bias in c. Repeat lengths were measured in nucleotides. n = 39 (Cast-biased loci) and n = 37 (B6-biased loci) were used for this comparison. Statistical analysis was performed using two-tailed unpaired t-tests; ****P < 0.0001. e, Allelic imbalance in FOXP3 binding in vitro. A total of 50 pairs of Cast and B6 sequences (Supplementary Table 2a) was chosen from the 76 pairs in d and analysed using FOXP3(∆N) pull-down. For each pair, the recovery rate of the Cast and B6 DNA was measured and their ratios were plotted. Each datapoint represents the average of the two pull-downs. Statistical analysis was performed using two-tailed unpaired t-tests. f, FOXP3–DNA interaction was measured using FOXP3(∆N) pull-down. DNA containing a random sequence (no FKHM), a single FKHM (1×FKHM), IR-FKHM or tandem repeats of TnG (n = 1–6) were used. All DNAs were 45 bp long. g, FOXP3–DNA interaction using DNAs (30 bp) containing various tandem repeats, including T3G repeats. h, FOXP3–DNA interaction using DNAs (45 bp) containing 4–11 repeats of T3G. i, Native gel shift assay of MBP-tagged FOXP3(∆N) (0–0.4 μM) with DNA (30 bp, 0.05 μM) containing IR-FKHM or (T3G)6. j, Representative negative-stain EM images of FOXP3(∆N) in a complex with (T3G)36 and (IR-FKHM)5. Both DNAs were 144 bp long. Scale bar, 100 nm.

