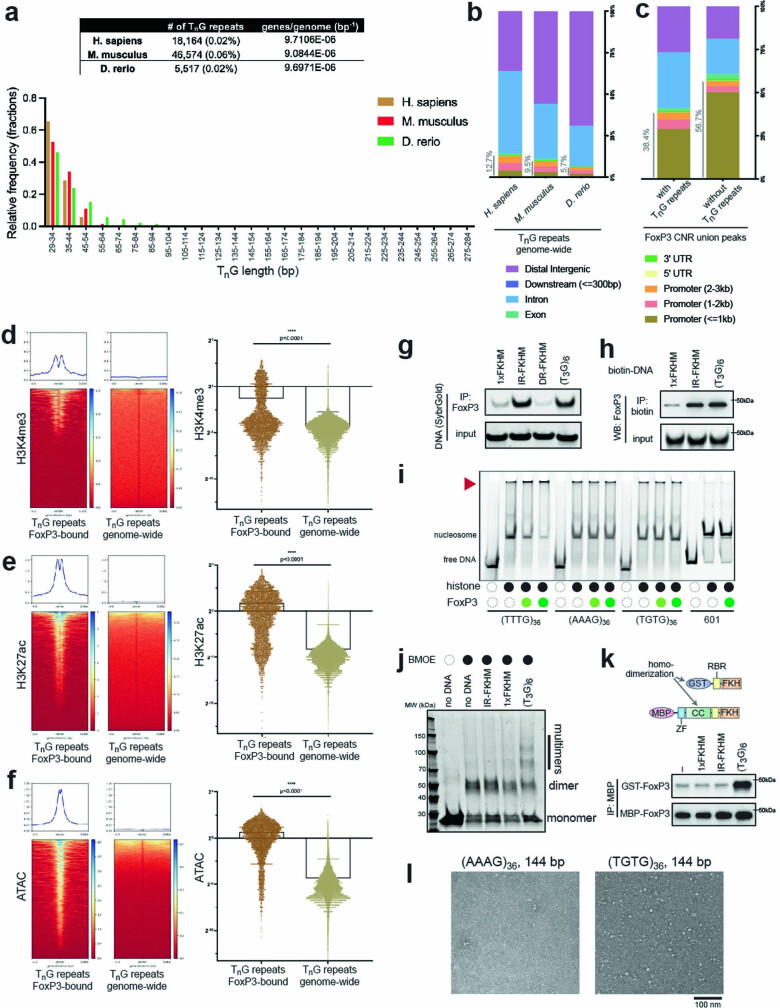
Extended Data Fig. 1. Analysis of T3G repeats in the genome and FoxP3 multimerization on T3G repeats.
a. TnG repeat-like sequences in the genomes of H. sapiens, M. musculus and D. rerio. Sequences that match the TnG repeat-like motif (29 nt motif from FoxP3 CNR overlap peaks, see Supplementary Table 1b) were identified using FIMO (p = 0.05, see Methods). Genomic percentage of TnG repeat-like sequences (in parenthesis) was the number of TnG repeat regions multiplied by the average size of the repeats (31, 33 and 38 bp for H. sapiens, M. musculus and D. rerio, respectively), divided by the genome size (3.2, 2.7 and 1.4 billion bp, respectively). Below: length distribution of the TnG repeat-like sequences. Genes-to-genome size ratio was calculated by dividing the number of genes used in the feature annotation (31,074, 24,528 and 13,576 in H. sapiens, M. musculus and D. rerio) by the genome size. b. Distribution of TnG repeat-like sequences in the genomes of H. sapiens, M. musculus and D. rerio relative to Transcription Start Sites (TSSs). c. Distribution of CNR union peaks (union of Rudensky CNR peaks and Dixon CNR peaks, n = 9,062) relative to TSSs. CNR union peaks with and without TnG repeat-like sequences (n = 3,301 and 5,761, respectively) were identified using FIMO (p = 0.05) as in (a). d-f. Comparison of (d) H3K4me3-ChIP, (e) H3K27ac-ChIP and (f) ATAC signal23 around the TnG repeat-like sequences that overlap with FoxP3 CNR union peaks vs. those genome-wide in thymic Tregs (n = 4,837 peaks and 41,889 peaks respectively). See Extended Data Fig. 4a–c for pre-thymic Tregs, which showed that high levels of H3K4me3, H3K27ac and ATAC signals were maintained prior to FoxP3 expression. TnG repeats in the blacklist were removed. Right: ChIP/ATAC signal was averaged over +/− 500 bp around the TnG repeat-like sequences. Two-tailed unpaired t-tests. ****, p < 0.0001. g. DNA sequence specificity of FoxP3 as measured by FoxP3 pull-down. HA-tagged, full-length FoxP3 was transiently expressed in HEK293T cells and purified by anti-HA IP. Equivalent amounts of indicated DNAs (30-31 bp) were added to FoxP3-bound beads and further purified by anti-HA IP prior to gel analysis. h. DNA sequence specificity of FoxP3 as measured by DNA pull-down. Equivalent amounts of biotinylated DNAs were mixed with FoxP3-expressing 293 T lysate and were subjected to streptavidin pull-down. Co-purified FoxP3 was analysed by anti-HA WB. i. FoxP3 binding to nucleosomal DNA as measured by native gel-shift assay. Indicated DNA was incubated with the histone octamer at 1:1 molar ratio (black circle), followed by incubation with FoxP3 (0.2 or 0.4 μM for light and dark green circles, respectively). Empty dotted circles indicate no histone or FoxP3. Sybrgold stain was used for visualization. With an increasing concentration of FoxP3, the intensity of the nucleosomal TTTG repeat decreased, while the signal in the gel well (red arrow) increased. Such changes were not observed with other DNAs. j. BMOE crosslinking of FoxP3∆N with and without DNA. FoxP3∆N can only form multimers on (T3G)6 DNA. k. Multimerization analysis of FoxP3, as measured by co-purification of FoxP3 with different tags. GST- and MBP-tagged FoxP3 were incubated together in the presence and absence of indicated DNA and were subjected to MBP pull-down, followed by WB analysis of GST-FoxP3 in eluate. Note that GST replaced the CC domain in FoxP3, disallowing hetero-dimerization between MBP-FoxP3 and GST-FoxP3. Thus, co-purification of these two proteins in the presence of T3G repeats suggests DNA sequence-dependent multimerization of the FoxP3 homodimer. l. Representative negative-stain EM images of FoxP3∆N in complex with (AAAG)36 (left) and (TGTG)36 (right).

