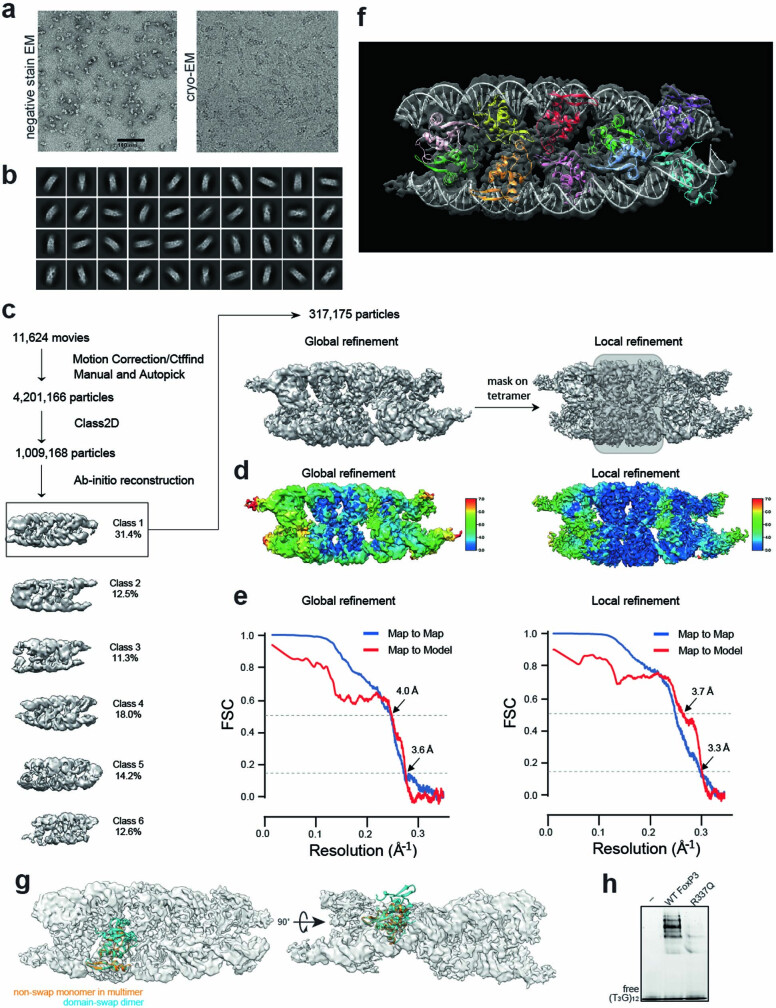
Extended Data Fig. 2. Cryo-EM structure of the FoxP3∆N–(T3G)18 complex.
a. Representative negative-stain EM (left) and cryo-EM images (right) of FoxP3∆N multimers on (T3G)18 DNA. b. 2D classes chosen for 3D reconstruction. c. Cryo-EM image processing workflow. See details in Methods. d. Local resolution for the maps of global refinement (left) and local refinement with a mask covering the central four subunits of FoxP3 (right). Local resolution was calculated by CryoSPARC. Resolution range was indicated according to the colour bar. e. Fourier shell correlation (FSC) curve for global refinement (left) and local refinement (right). Map-to-Map FSC curve was calculated between the two independently refined half-maps after masking (blue line), and the overall resolution was determined by gold standard FSC = 0.143 criterion. Map-to-Model FSC was calculated between the refined atomic models and maps (red line). f. Cryo-EM map and ribbon model of FoxP3∆N decamer in complex with two (T3G)18 DNAs (PDB: 8SRP, EMDB: 40737). DNA molecules are coloured grey. Individual FoxP3 monomers are coloured differently. g. Superposition of the domain-swap dimeric structure of FoxP3 (cyan, PDB:4WK8) onto any subunit of the FoxP3 multimeric structure (represented here by the orange subunit) by aligning the common portions of FoxP3 reveals that the domain-swap dimer is incompatible with the density map. h. Native gel shift analysis of MBP-tagged FoxP3∆N (WT or R337Q, 0.4 μM) with (T3G)12 DNA (0.05 μM). Note that R337Q induces domain-swap dimerization.

