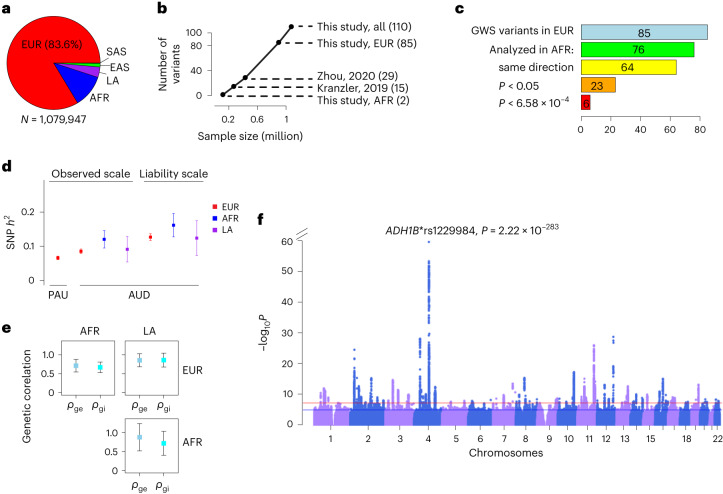
Fig. 1. Genetic architecture of PAU.
a, Sample sizes in different ancestral groups. b, Relationship between sample size and number of independent variants identified. Kranzler et al., 2019: cross-ancestry meta-analysis for AUD; Zhou et al., 2020: PAU in EUR. c, Lookup for cross-ancestry replication in AFR for the 85 independent variants in the EUR meta-analysis. Of the 85 variants, 76 could be analyzed in AFR (Methods). A sign test was performed for the number of variants with same direction of effect (64/76, binomial test P = 1.0 × 10⁻⁹). Twenty-three variants were nominally significant (P < 0.05) in AFR and six were significant after multiple correction (P < 0.05/76 = 6.58 × 10⁻⁴). d, Observed-scale and liability-scale SNP-based heritability (h2) in multiple ancestries. For PAU in EUR, N = 903,147 and for AUD, N = 753,249 (EUR), N = 122,571 (AFR) and N = 38,962 (LA). The error bar is the 95% confidence interval. e, Cross-ancestry genetic-effect correlation (ρge) and genetic-impact correlation (ρgi) among EUR (N = 903,147), AFR (N = 122,571) and LA (N = 38,962) ancestries. The error bar is the 95% confidence interval. f, Genome-wide association results for PAU in the cross-ancestry meta-analysis (N = 1,079,947 and Neffective = 646,371). Effective sample size-weighted meta-analyses were performed using METAL. Red line is significance threshold of 5 × 10⁻⁸.

