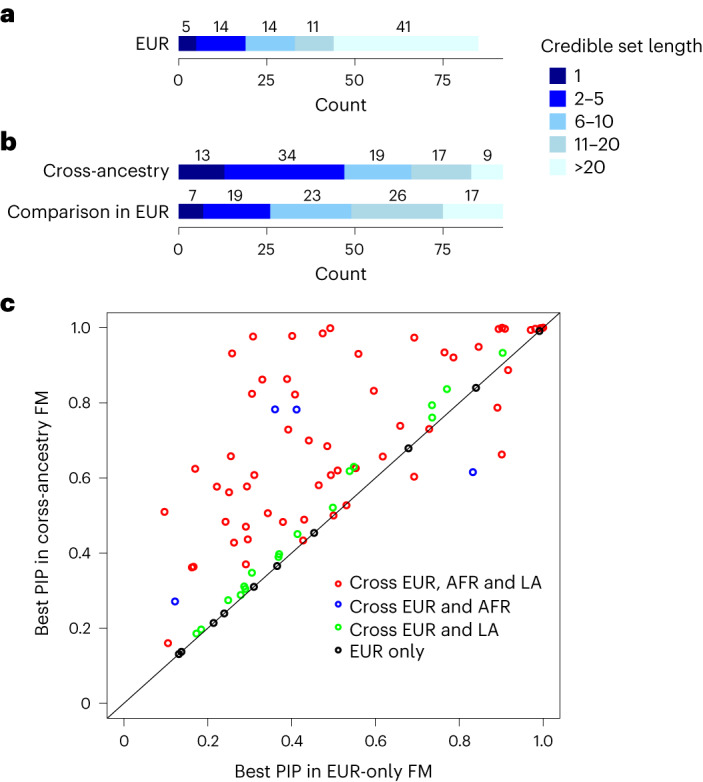
Fig. 2. Fine mapping for PAU.

a, Fine mapping of causal variants in 85 regions in EUR. b, Ninety-two regions in a cross-ancestry analysis were fine mapped and a direct comparison was done for these regions in EUR. c, Comparison for the highest PIPs from cross-ancestry and EUR-only fine mapping in the 92 regions. Red dots are the regions fine mapped across EUR, AFR and LA; blue dots are the regions fine mapped across EUR and AFR; green dots are the regions fine mapped across EUR and LA; and black dots are the regions only fine mapped in EUR. FM, fine mapping.
