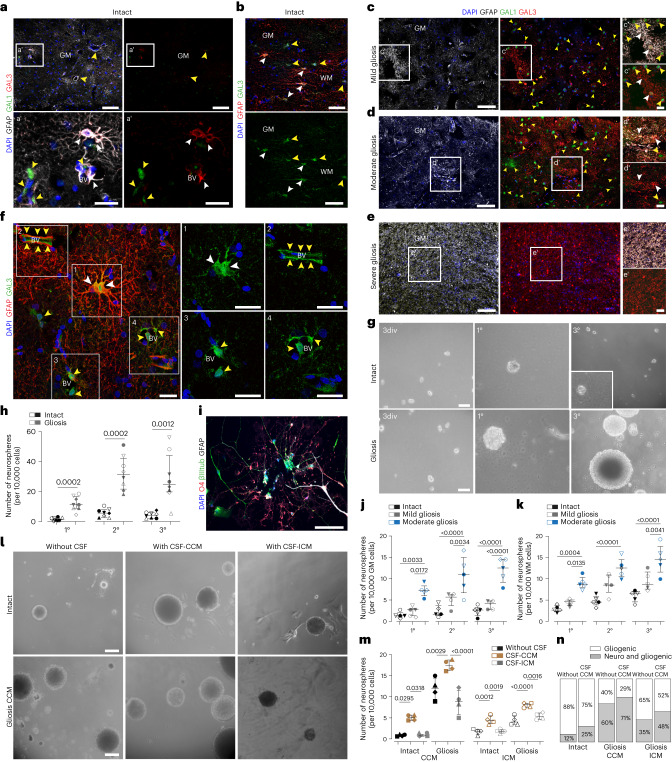
Fig. 3. CCM induced astrocyte proliferation is accompanied by upregulation of GAL1/GAL3 and correlated with acquisition of NSC potential in vitro.
a–e, Representative images of GFAP, GAL1 and GAL3 immunolabeling of intact GM (a, a′), WM (b) and CCM-induced mild (c, c′), moderate (d, d′) and severe (e, e′) gliosis. Yellow arrowheads indicate examples of GAL1+ cells; white arrowheads indicate examples of GAL3+GFAP+ cells. f, Representative image showing GAL3 immunostaining in GFAP+ dividing astrocyte (1), perivascular cells and at BV surface (2–4) within the gliotic parenchyma. Yellow arrowheads indicate Gal3+, GFAP-negative cells and outline BV; white arrowheads indicate of GAL3+GFAP+ cells. g,h, Examples of neurospheres derived from the intact or gliotic tissue samples (g) and the quantification of primary (1°), secondary (2°) and tertiary (3°) neurospheres generated after 14 d.i.v. (h). Data are presented as median and interquartile range. Each dot represents one patient. Two-sided P values from Mann–Whitney test. i, Representative image of βIII tubulin, GFAP and O4 immunostaining of differentiated neurosphere. j,k, The frequency of neurosphere-forming cells in the intact, mild or moderate gliotic GM (j) and WM (k). Data are shown as median with interquartile range (n = 5 patients per data group). Adjusted P values from one-way ANOVA followed by Tukey’s multiple comparison test. l,m, Disease-dependent CSF effects on sphere-forming capacity in human cortical cells obtained from CCM patients (l) and quantitative evaluation of these effects on the percent of neurospheres formed from 10,000 cortical cells from patients with CCM or ICM (m). Data in m are presented as median with interquartile range. Each dot represents one patient. Adjusted P values from one-way ANOVA followed by Tukey’s multiple comparison test. n, Neurospheres generated in the presence of CSF-CCM exhibit an increased neurogenic capacity. The frequency of neurogenic/gliogenic versus only gliogenic neurospeheres (n = 4 patients per data group per diagnosis). Scale bars: 130 µm (c–e), 100 µm (a and b), 50 µm (g, i and l) and 25 µm (a′, c′–e′ and f).

