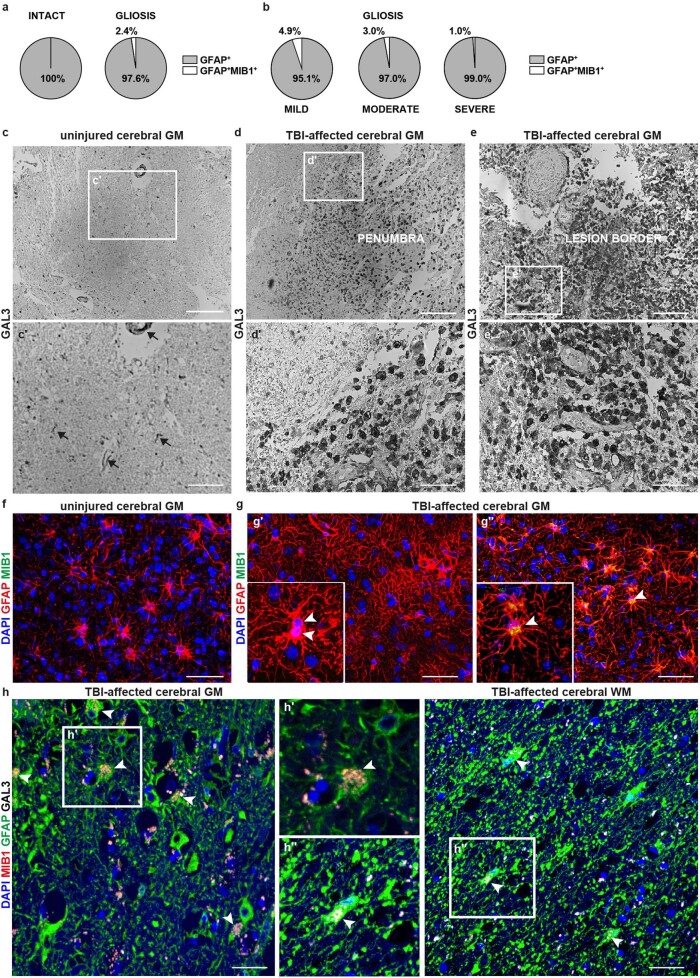
Extended Data Fig. 2. Astrocyte proliferation in the cerebral cortex from CCM or TBI patients.
(a, b) Pie charts showing the mean percentage of GFAP+MIB1+ cells among the total GFAP+ population in the intact and CCM-affected cerebral parenchyma and regions of mild, moderate and severe gliosis (n = 4 patients). (c-e) Immunohistochemical detection of GAL3 (based on the diamnobenzidine reaction) in postmortem samples of the cerebral cortex from TBI patients (n = 4). Higher magnification of boxed areas (c′e′) shows details of GAL3 immunoreactivity within the uninjured region (c), the penumbra (d) and directly at the border of the lesion (e). (f, g) Representative single optical projections of GFAP and MIB1 immunolabelling in the intact (f) and TBI-affected (g) cerebral cortex (n = 3 patients). Note that some hypertrophic GFAP+ astrocytes are MIB1+ and divide within the gliotic GM (white arrowheads in inserts g′, g′′). (h) Maximum intensity projections show examples for GFAP, GAL3 and MIB1 immunolabeling in the TBI-affected cerebral GM (left panel) and WM (right panel) (n = 3 patients). Examples of MIB1+GFAP+GAL3+ cells are indicated by white arrowheads, and the boxed areas (h′ and h′′) are shown at higher magnification. Further examples in Fig. 6 and Extended Data Fig. 9. BV: blood vessel, GM: cerebral grey matter, WM: cerebral white matter. Scale bars: 200 µm (c, d, e), 100 µm (c′, f, g), 50 µm (d′, e′, h).

