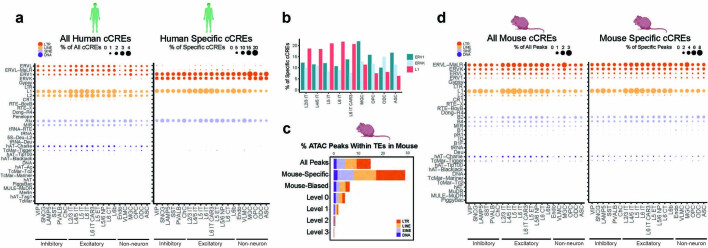
Extended Data Fig. 4. cCRE enrichment in TEs.
a. Dot plots showing the percentage of all (left) or human-specific (right) cCREs in different subclasses of TEs for each cell type. b. Bar plots showing the percentage of human-specific cCREs that overlap ERV1, ERVK, or LINE-1 for IT neurons and glia. c. Stacked bar plots showing percentage of mouse cCREs in TEs for different conservation groups. d. Dot plots showing the percentage of all (left) or mouse-specific (right) cCREs in different subclasses of TEs for each cell type. Species silhouettes in a, c and d created in BioRender.

