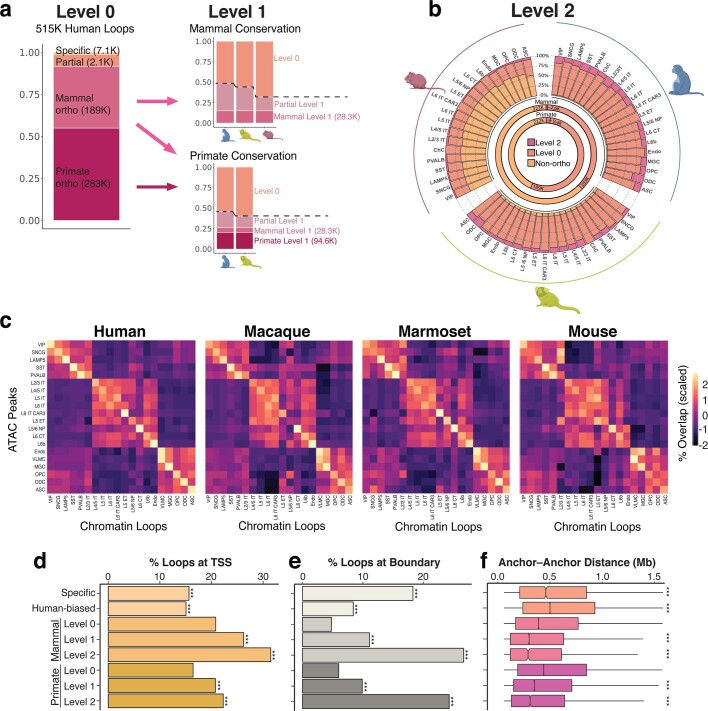
Extended Data Fig. 7. Chromatin Loop enrichment in TEs.
a. Stacked bar plots representing the breakdown of human boundaries for each indicated group for level 0 and level 1 conservation. b. Level 2 conservation of human boundaries showing the overlap between each species for the same cell type (outer circle stacked bars). Inner circles showing the breakdown for mammal and primate comparisons for all human boundaries. c. Heatmaps for each species showing the scaled percentage overlap of peaks and loops across cell types. d. Barplot showing the percent of loops with a TSS overlapping at least one anchor bin. *** p < 2e-16 from Fisher’s exact test compared to mammal level 0, except primate level 1 and 2 were compared to primate level 0. e. Barplot showing the percent of loops with a boundary overlapping at least one anchor bin. P-values same as in d. f. Boxplots of anchor to anchor distance for loops of indicated conservation level. *** p < 2e-16 from two-sided, unpaired Wilcoxon rank sum. Box plots encompass 25th to 75th percentiles; central lines represent medians; whiskers represent 1.5 times the interquartile interval. Sample sizes reported in Supplementary Table 34. Species silhouettes in a and b created in BioRender.

