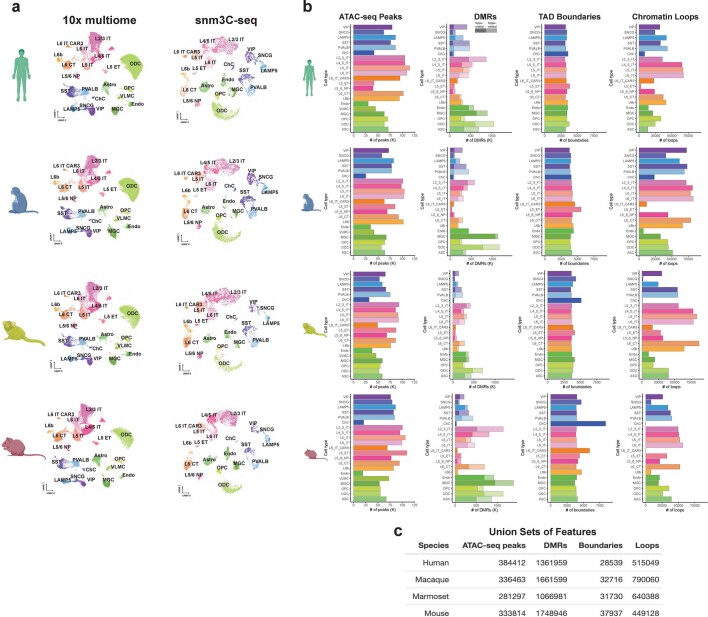
Extended Data Fig. 1. Cell type quantification in each species.
a. Uniform manifold approximation and projection (UMAP)70 embeddings of 10x multiome RNA (left) and snm3C-seq DNA methylation (right) clusters for human, macaque, marmoset, and mouse separately. b. Number of indicated features (ATAC-seq peaks, DMRs, TAD boundaries, or chromatin loops) identified for each cell type for each species. c. Numbers of unique features found in each species, i.e. union set of features. Species silhouettes in a and b created in BioRender.

