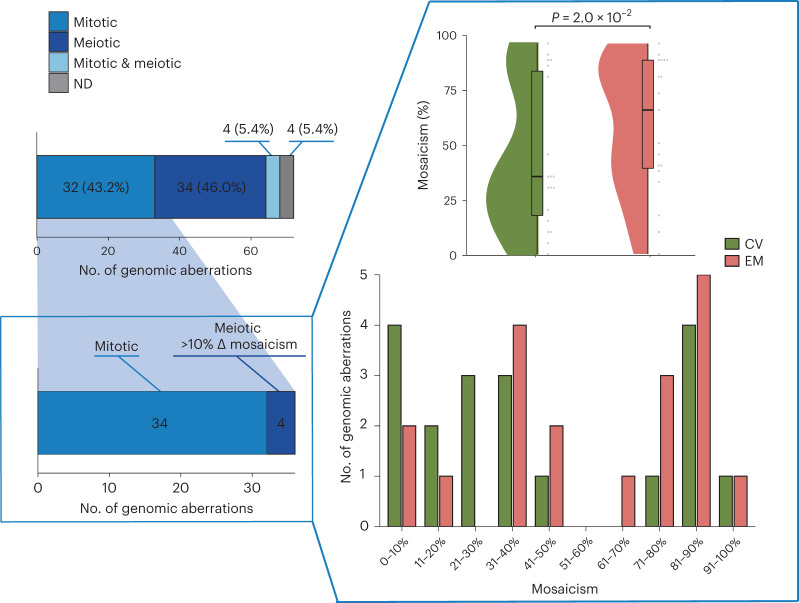
Fig. 4. Segregational and lineage origins of pregnancy losses.
Segregational origin of each individual aberration in both extra-embryonic mesoderm (EM) and chorionic villi (CV) tissue per POC detected by genome haplarithmisis, whereas samples with aberrations of mitotic origin (n = 34: 17 EM and 17 CV) or meiotic origin with greater than 10% mosaicism difference between EM and CV (n = 4: two EM and two CV) were selected for EM/CV plots and mosaicism statistics. The mosaicism degree in EM samples (n = 19) was significantly higher than that in CV samples (n = 19) (two-sided Wilcoxon signed-rank test). The box plot represents the 25th percentile, median and 75th percentile, respectively, whereas the whiskers extend to the farthest data point that is no more than 1.5 times the interquartile range (IQR) from the upper or lower quartile. ND, not determined.

