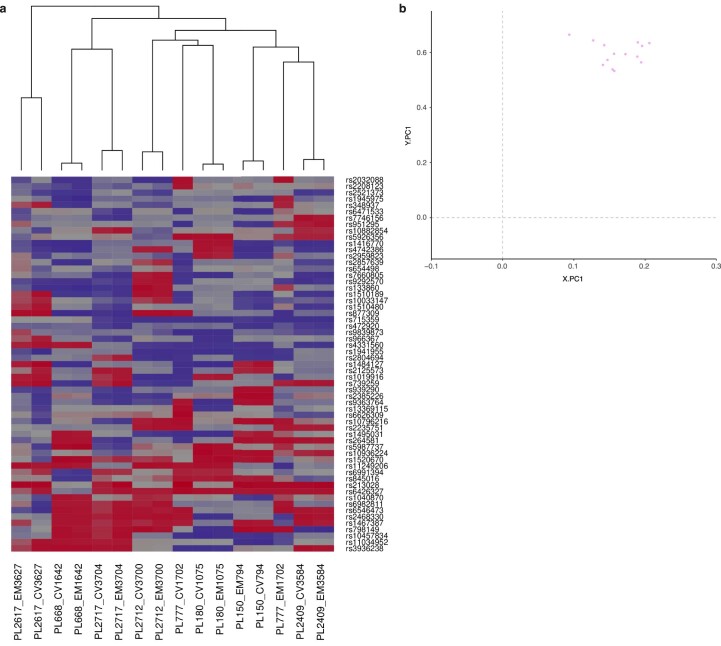
Extended Data Fig. 3. Heatmap and PCA of EM and CV tissue samples.
a, Heatmap of EPIC array SNP probes (n = 59) of all paired EM and CV tissue samples (n = 13). Hierarchical clustering of the samples was constructed using Euclidian distance and complete linkage and is shown as a dendrogram. b, Scatter plot showing the projection of all EM and CV tissue samples (n = 13) into the principal component space generated using reference data for sex prediction (not shown). All chosen samples were female according to the haplotyping analysis and the methylation sex prediction. Grey dashed lines separate the quadrants where male (XY) samples are expected to map to the lower left quadrant and female (XX) samples to the upper right quadrant.

