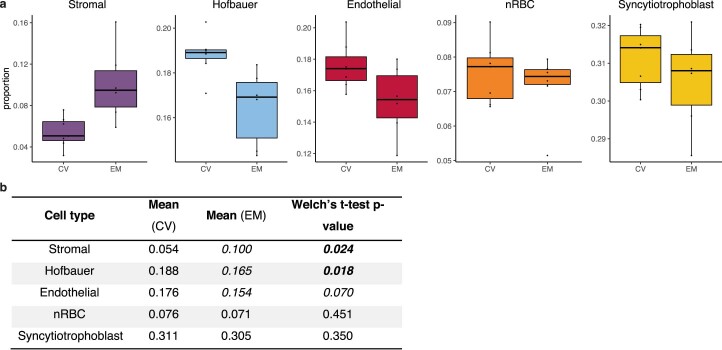
Extended Data Fig. 4. Predicted cell composition of EM and CV samples based on methylation data.
a, Boxplots showing the predicted cellular composition of the high DNA quality EM (n = 6) and CV (n = 7) samples for each cell type: stromal cells, Hofbauer cells, Endothelial cells, nucleated red blood cells (nRBCs) and syncytiotrophoblast cells. The horizontal lines of the of the boxplot represent the 25th percentile, median and 75th percentile respectively while the whiskers extend to the farthest data point that is no more than 1.5 times the interquartile range (IQR) from the upper or lower quartile. The dots represent individual samples. b, Table with mean values of each cell type, P values were calculated with two-sided Welch’s T-test.

