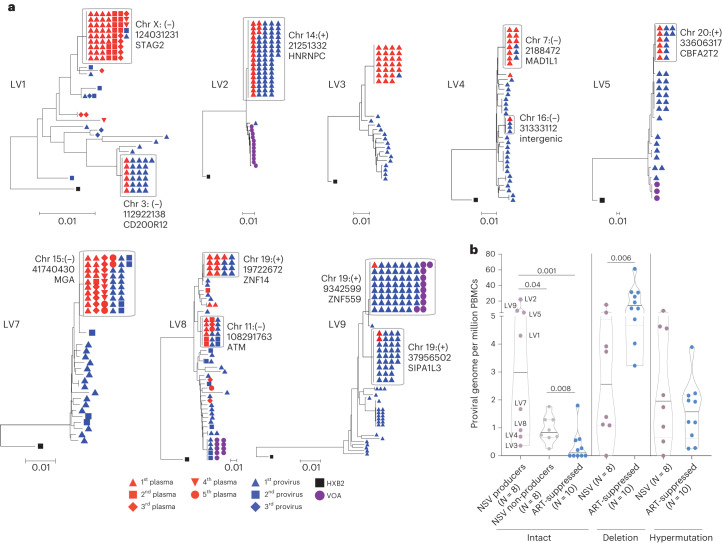
Fig. 2. Sequencing overview of the non-suppressible viremia cohort.
a, Neighbor joining trees show intact proviral and plasma sequences from different time points. The host integration sites of the producer proviruses are labeled. b, Comparison of reservoir size (number of proviral sequences per million cells) for producer proviruses versus non-producer proviruses in participants with NSV versus intact proviral reservoir size of ART-suppressed individuals. Median and interquartile ranges are labeled in the violin plot. Two-sided Wilcoxon matched-pairs signed-rank test and Mann–Whitney U tests were used for comparisons.

