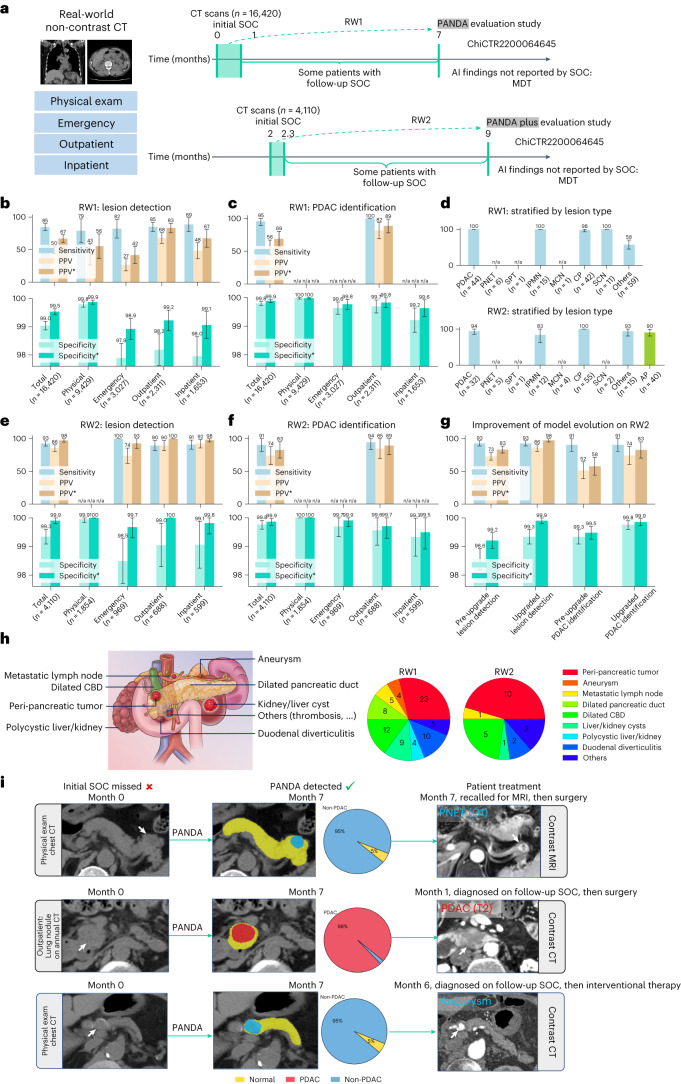
Fig. 5. Real-world clinical evaluation.
a, The data collection process of two real-world datasets, that is, RW1 and RW2, for the original PANDA model and the upgraded PANDA Plus model, respectively. SOC, standard of care. b,c,e,f, The sensitivity, specificity and PPV on RW1 (n = 16,420) and RW2 (n = 4,110). The superscript * represents adjusted results if we exclude cases of (peri-)pancreatic findings. d, Proportion of different lesion types detected in RW1 (n = 179) and RW2 (n = 166). g, The comparison between PANDA and PANDA Plus on RW2 (n = 4,110). Error bars indicate 95% CI. The center shows the computed mean of the metric specified by the respective axis labels. The results of subgroups with too few samples to be studied reliably (≤10) are omitted and marked as ‘n/a’. h, Examples of (peri-)pancreatic findings (left) and the number detected by PANDA (right). CBD, common bile duct. i, Examples of cases in which the lesion was missed by the initial SOC but was detected by PANDA.

