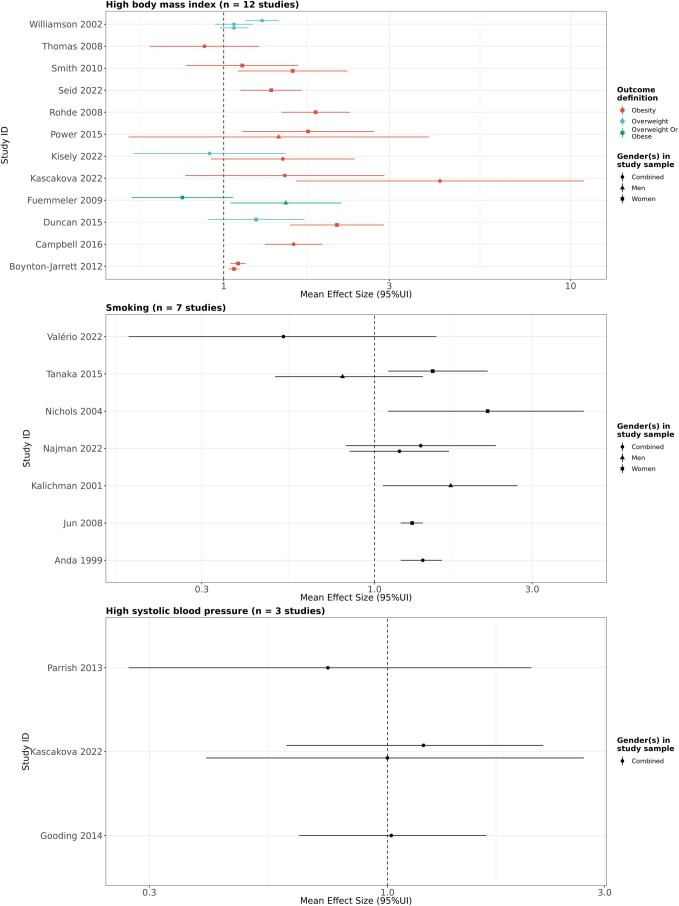
Extended Data Fig. 9. Forest plots showing extracted studies describing the association between childhood sexual abuse and the risk for high body mass index, smoking, and high systolic blood pressure.
These forest plots present extracted mean relative risks (colored points) for each of the three outcomes for which we found studies in association with childhood sexual abuse exposure (high body mass index, smoking, high systolic blood pressure). In the first panel (high body mass index) the color of the point indicates whether the study describes obesity or overweight as an outcome. In all panels, the shape of the point indicates gender of the study sample. The horizontal lines indicate the 95% uncertainty interval from the included study. We included multiple observations from a single study when effects were reported by severity/frequency of exposure and/or separately by gender or other subgroups.

