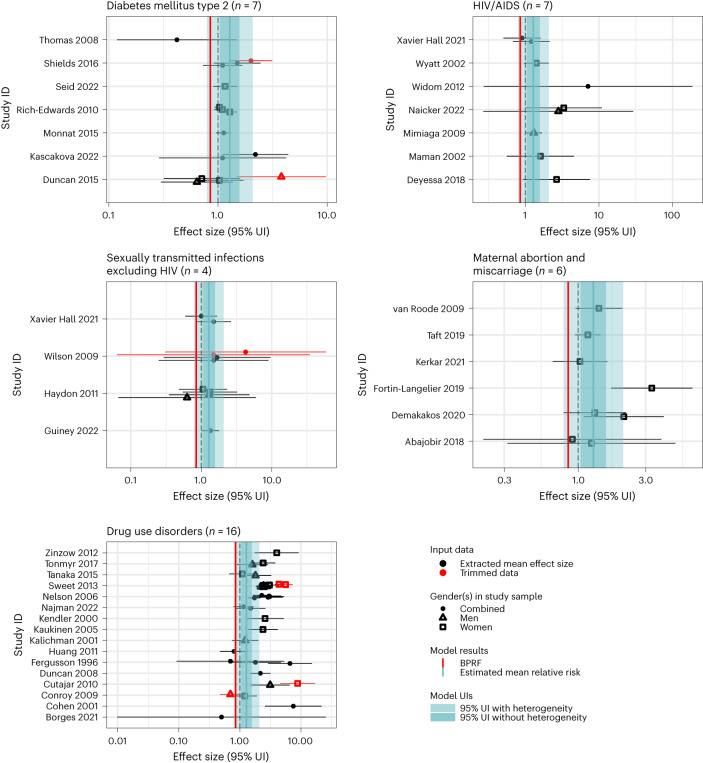
Fig. 3. These forest plots present estimated mean relative risks, their 95% uncertainty intervals and the data points underlying the estimates for five outcomes studied in association with childhood sexual abuse and found to have a one-star rating of the risk–outcome relationship (diabetes mellitus, HIV/AIDS, maternal abortion and miscarriage, sexually transmitted infections excluding HIV and drug use disorders).
The shape of the point indicates the sample gender and the color indicates whether the point was detected and trimmed as an outlier. The light blue interval corresponds to the 95% UI incorporating between-study heterogeneity; the dark blue interval corresponds to the 95% UI without between-study heterogeneity. The black vertical dotted line reflects the null RR value (one) and the red vertical line is the burden of proof function at the fifth quantile for these harmful risk–outcome associations. The black data points and horizontal lines each correspond to an effect size and 95% UI from the included study identified on the y axis. We included multiple observations from a single study when effects were reported by severity/frequency of exposure and/or separately by gender or other subgroups. Supplementary Table 16 provides more details on included observations from each study.

