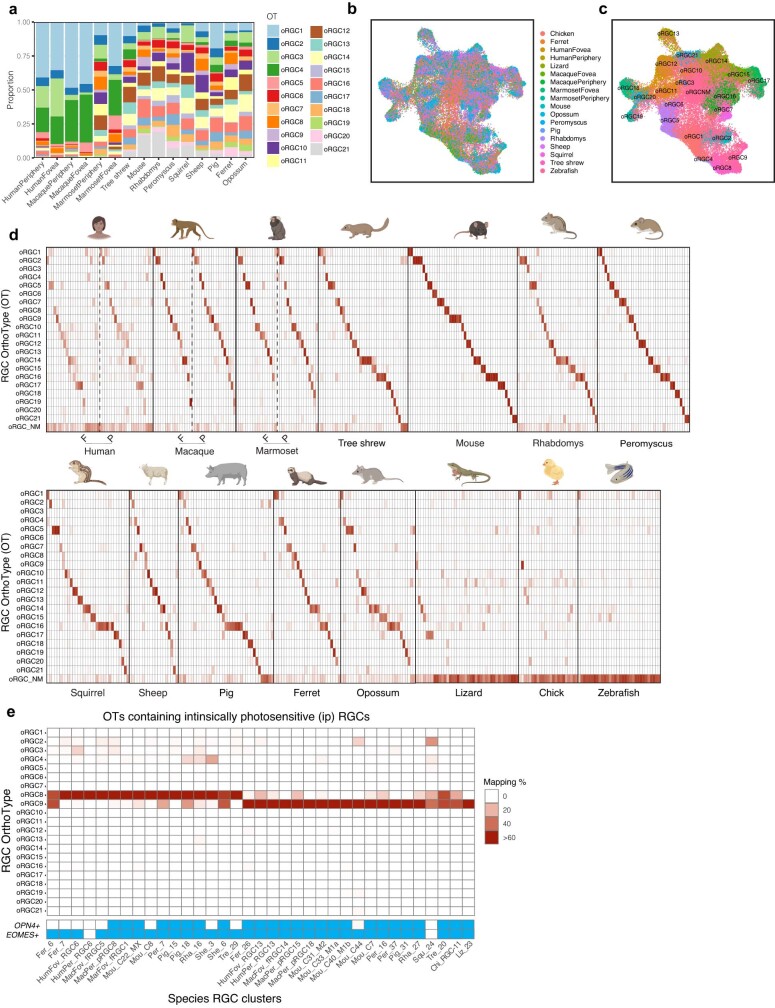
Extended Data Fig. 10. Retinal Ganglion Cell OrthoType analysis including non-mammals.
a. Barplot showing within-species relative frequencies (y-axis) of the 21 RGC OTs within mammalian species (x-axis) (Fig. 4b). The foveal and peripheral data from primates are shown separately. Cow is excluded due to the paucity of data. b. Integrated UMAP of RGCs from all 15 jawed vertebrates (excluding cow). Cells are colored by species of origin. For primates, fovea and periphery are plotted separately. c. Same as b, with cells colored by RGC OT. OTs 1-21 map 1:1 to the mammalian OTs in Fig. 4b, but we recover an additional OT (NM) predominantly containing non-mammalian RGCs from chick, lizard and zebrafish (also see panel d). d. Confusion matrices showing the mapping of species RGC clusters (columns) to RGC OTs (rows) identified by integrating RGCs from all jawed vertebrates (panel c). Representation as in Fig. 4d. Mammalian RGC clusters predominantly map to the mammalian OTs (rows 1-21), and the pattern of mapping is similar to Fig. 4d. Except for ipRGCs, chick, lizard and zebrafish RGCs largely map to oRGC_NM (row 22). e. Confusion matrix showing the species-specific RGC clusters (columns) that map to the oRGC8 and 9, corresponding to ipRGCs. Representation as in Fig. 3f. Annotation bar (bottom) highlights species-specific RGC clusters that express OPN4 and EOMES, a transcription factor expressed selectively by ipRGCs20,21.

