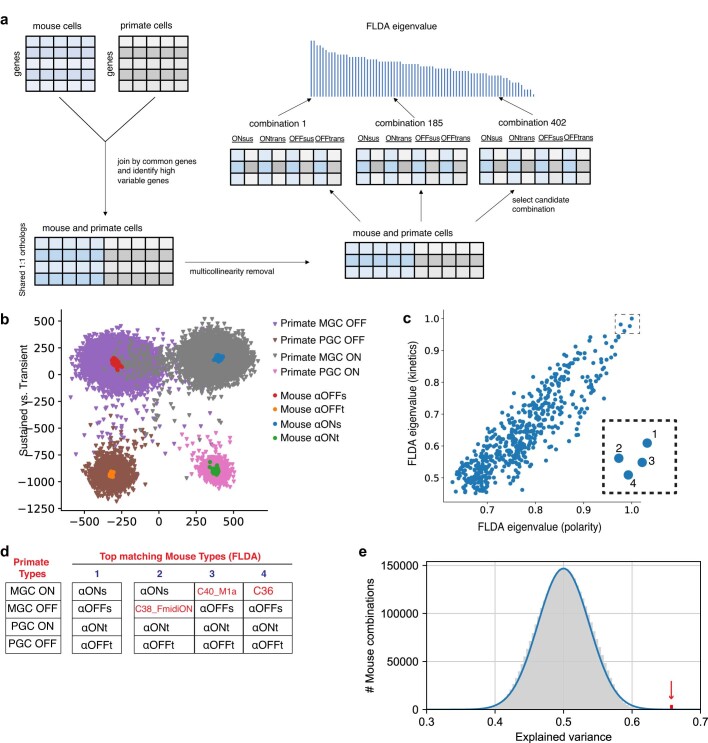
Extended Data Fig. 12. Factorized Linear Discriminant Analysis (FLDA) and Geometric Analysis of Gene Expression (GAGE).
a. FLDA workflow and eigenvalue analysis. The gene expression matrices of primate and mouse RGCs were combined by their shared orthologous genes. Highly variable genes were selected, and PCA was applied to remove multicollinearity. FLDA was performed on different combinations of mouse RGC candidates with known polarity and kinetics listed Supplementary Table 4. The combinations were ranked based on their FLDA eigenvalues, which measures the variance along each attribute captured in the projection. b. Visualization of the FLDA projection (Fig. 5c) along the 2D subspace corresponding to polarity (x-axis) and kinetics (y-axis). c. Scatter plot of the FLDA eigenvalues for the kinetics (y-axis) vs. polarity (x-axis), measuring the magnitude of the variance corresponding to these attributes captured in the projection. Inset highlights the top four matches (numbered 1-4) from the 432 combinations of 4 mouse types shown in Supplementary Table 4. d. Mouse RGC types present within the top four combinations out of the 432 combinations in panel c. The top matched set contains all four α-RGC types; the next three include 3 α-RGC types. e. Geometric analysis of gene expression (GAGE) in which primate MGCs and PGCs are compared to all combinations of 4 mouse RGC types (45 choose 4 * 4! = 3,575,880) rather than only the 432 curated combinations used to generate Fig. 5d. Grey bars: histogram of scores for all sets of 4 mouse types. Red bar highlights the set of 4 α-RGC types with the correct matching of polarity and kinetics with the primate types, also marked by the red arrow located at a score of x = 0.657. The bulk of the distribution is approximated as a Gaussian with mean 0.50 and standard deviation 0.0374 (blue line). The 4 α-RGC fit has the second highest score among ~3.6 million candidates. The null hypothesis that this arises by chance has a p-value of p < 10−6 based on a one-sided Student’s t-test. The top scoring combination with a score of 0.658 involves mouse RGC types C18, C7, C39 and C8 corresponding to the ON PGC, ON MGC, OFF PGC and OFF MGC respectively. Of the four mouse types, two – C18 and C8 - have been physiologically characterized to exhibit sustained ON responses38, which violates their expected phenotypic correspondence to ON PGC (ON transient) and OFF MGC (OFF sustained).

