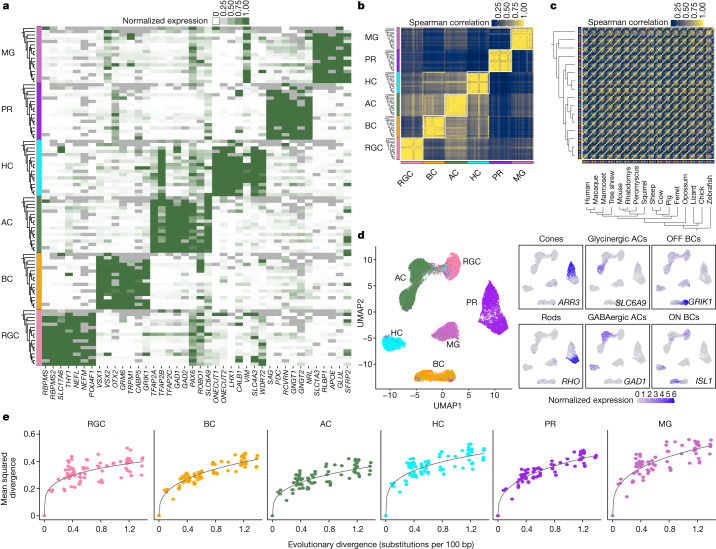
Fig. 2. Class- and subclass-specific transcriptomic signatures.
a, Heat map showing average expression of marker genes (columns) within each major cell class in 17 species (rows). Rows are grouped by cell class (left). Within each class, species are ordered as in Fig. 1b. Grey tiles indicate data that are missing owing to the absence of the corresponding orthologue in the species annotation. Colours indicating cell class are uniform in a–e. PR, photoreceptor. b, Cross-correlation matrix (Spearman) of pseudobulk transcriptomic profiles for the 16 jawed vertebrates. Rows and columns are grouped by class, and then ordered by phylogeny within a class. A total of 4,560 1:1 gene orthologues were used to calculate the correlation values. c, As in b, with rows and columns grouped by species instead of class. Matrices including lamprey are shown in Extended Data Fig. 7c,d. d, Left, uniform manifold approximation and projection (UMAP) embedding of integrated cross-species data, with points indicating class identity (left) or expression levels of subclass-specific markers (right). GAD1, a marker for GABAergic amacrine cells, is also expressed by some horizontal cells, and ISL1, a marker for ON bipolar cells, is also expressed by some RGCs, horizontal cells, and amacrine cells. Details of gene expression by species are shown in Extended Data Fig. 8d. e, Pairwise mean squared divergence of class-specific pseudobulk gene expression profiles between species (y axis) increases with evolutionary distance, as estimated by substitutions per 100 bp (x axis). Data from mammals, chicken and lizard are included. Data including zebrafish are presented in Extended Data Fig. 7e. Solid lines represent power law (y = axb) regression fits. Across the graphs, and . The coefficient of determination (R2) values range from 0.75 to 0.92.

