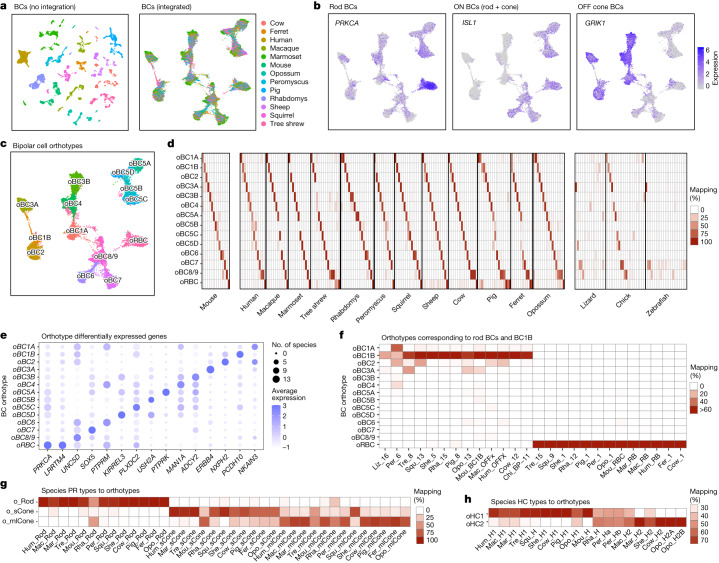
Fig. 3. Multispecies integration of bipolar cells.
a, UMAP of mammalian bipolar cells computed with the raw (left) and integrated (right) gene expression matrices. Cells are coloured by species of origin. b, Feature plots showing expression within the integrated space of the rod bipolar cell marker PRKCA, the ON bipolar cell marker ISL1, and the OFF bipolar cell marker GRIK1. c, As in a, but with cells coloured by orthotype identity. d, Left, confusion matrix showing the percentage of cells from each mouse bipolar cell-type mapping to each mammalian bipolar cell orthotype. Each column sums to 100%. See Extended Data Fig. 9a for a higher magnification view. Centre, confusion matrix showing specific mapping between mammalian bipolar cell orthotypes and bipolar cell clusters within each mammalian species (Extended Data Figs. 1 and 3–6). Right, confusion matrices showing the mapping of bipolar cell clusters in lizard, chick and zebrafish to the mammalian bipolar cell orthotype. Mapping that includes non-mammalian orthotype is shown in Extended Data Fig. 9e. e, Dot plot showing differentially expressed genes within each bipolar cell orthotype. The size of the dot represents the number of mammalian species (out of 13 mammalian species in total) that express the gene in at least 30% of cells in the corresponding orthotype, and the colour represents normalized expression level. f, Confusion matrix showing the species bipolar cell clusters (columns) that map specifically to the orthotype oRBC and oBC1B. Bipolar cell types are named on the basis of their species of origin and within-species bipolar cell cluster ID (Extended Data Figs. 1 and 3–6); for example, Peromyscus bipolar cell cluster 1 is called ‘Per_1’. g,h, Confusion matrix showing mapping of mammalian photoreceptor (g) and horizontal cell (h) types to orthotype. Format as in d, centre.

