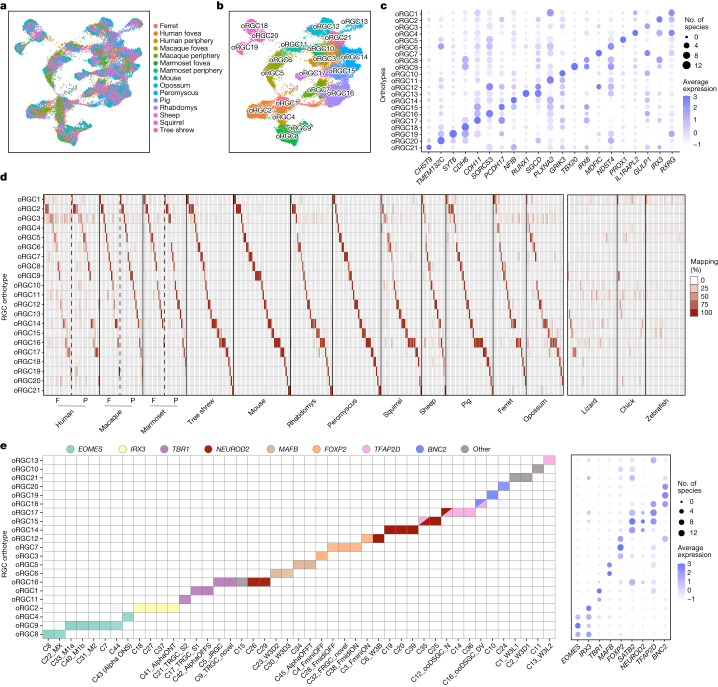
Fig. 4. Multispecies integration of retinal ganglion cells.
a, Integrated UMAP of RGCs from 12 mammals (cow was excluded owing to the paucity of RGC data.). Cells are labelled by species of origin. For primates, cells from fovea and periphery are plotted separately. b, As in a, with RGCs labelled by orthotype. c, Dot plot showing differentially expressed genes within each RGC orthotype. Representation as in Fig. 3e. d, Left, confusion matrices showing that species-specific RGC clusters (Extended Data Figs. 1 and 3–6) map to mammalian RGC orthotypes in a specific fashion. Representation as in Fig. 3d, centre, except that clusters from fovea (F) and periphery (P) are mapped separately for primates. Right, confusion matrices showing the mapping of RGC clusters (columns) in lizard, chick and zebrafish to the 21 mammalian RGC orthotypes. Mapping to the single non-mammalian RGC orthotype is shown in Extended Data Fig. 10d. e, Left, confusion matrix showing that mouse RGC types (rows; naming as in ref. 20) belonging to transcription factor-based subsets39 (colours) map to the same orthotypes (columns). Right, dot plot showing specific expression patterns of subclass-specific transcription factor-encoding genes39 in orthotypes. Representation as in Fig. 3e.

