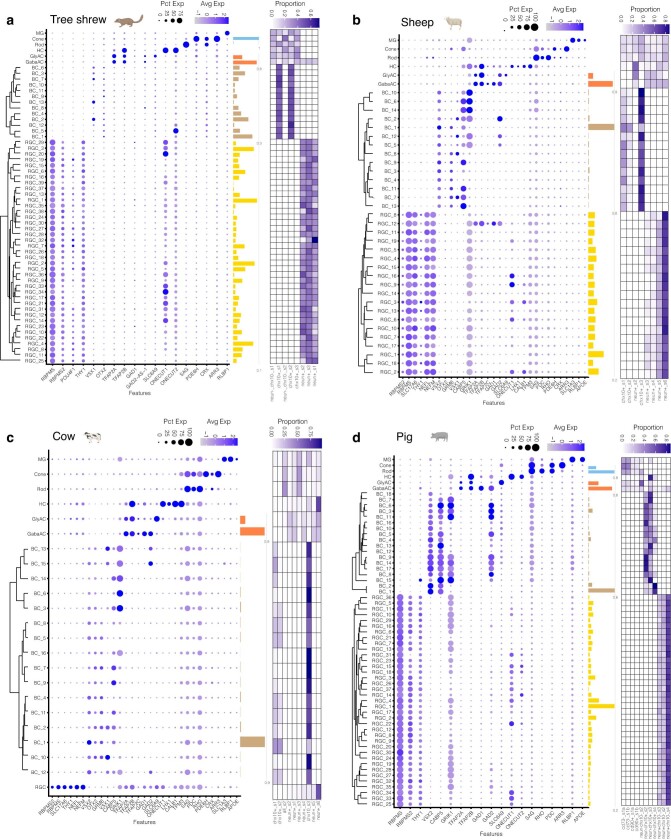
Extended Data Fig. 3. Summary of cell type atlases for tree shrew, sheep, cow, and pig.
a. Dotplot showing expression of cell class-specific markers (columns) in the tree shrew (n = 3 animals; 71,571 nuclei) clusters (rows). The size of each dot represents the fraction of nuclei in the group with non-zero expression, and the color represents expression level. The six classes are MG, HC, PR (subdivided into Rod and Cone), AC (subdivided into GABAergic AC (GabaAC) and glycinergic AC (Gly AC)), BCs and RGCs. Only BCs and RGCs have been subclassified through a within-species integration and clustering analysis (Methods). Rows corresponding to BC and RGC clusters are ordered based on a hierarchical clustering analysis (dendrograms, left). Barplot on the right of the dotplot depicts the relative frequency of each cluster within a class (colors). The rightmost heatmap depicts the distribution of each cluster across samples (columns). Panels b-d depict the same information as panel a for sheep (n = 6 animals; 65,490 nuclei) (b), cow (n = 6 animals; 75,794 nuclei) (c), and pig (n = 4 animals; 49,955 nuclei) (d). Note that in this figure, as well as Extended Data Figs. 1 and 4–6, the proportions shown accurately report our data but do not necessarily represent the true endogenous proportions. This is because in many cases we depleted photoreceptors or enriched BCs or RGCs to obtain sufficient numbers of rare cell types (see Methods).

