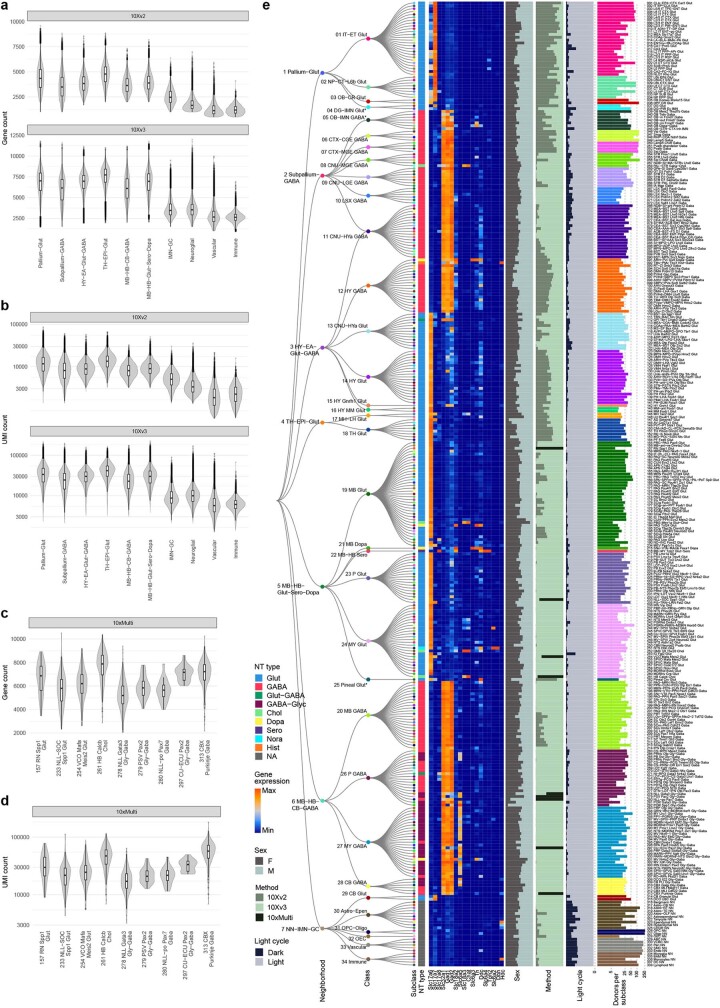
Extended Data Fig. 5. Transcriptomic cell type taxonomy of the whole mouse brain with additional metadata information.
(a-b) Number of genes (a) or number of UMIs (b) detected per cell in 10xv2 (top) or 10xv3 (bottom) datasets for each cell type neighborhood. The data shown is post-QC. Numbers of cells for 10xv2: Pallium-Glut n = 1,128,664, Subpallium-GABA n = 269,307, HY-EA-Glut-GABA n = 107,706, TH-EPI-Glut n = 73,702, MB-HB-CB-GABA n = 18,590, MB-HB-Glut-Sero-Dopa n = 20,089, IMN-GC n = 123,650, Neuroglial n = 80,959, Vascular n = 6,894, Immune n = 4,941. Numbers of cells for 10xv3: Pallium-Glut n = 366,137, Subpallium-GABA n = 342,116, HY-EA-Glut-GABA n = 187,742, TH-EPI-Glut n = 52,469, MB-HB-CB-GABA n = 167,425, MB-HB-Glut-Sero-Dopa n = 159,653, IMN-GC n = 209,310, Neuroglial n = 774,537, Vascular n = 130,599, Immune n = 87,639. (c-d) Number of genes (c) or number of UMIs (d) detected per nucleus in the 10xMulti dataset (post-QC) for each subclass where 10xMulti nuclei were added. Numbers of nuclei: 157 RN Spp1 Glut n = 48, 233 NLL-SOC Spp1 Glut n = 115, 254 VCO Mafa Meis2 Glut n = 490, 261 HB Calcb Chol n = 274, 278 NLL Gata3 Gly-Gaba n = 339, 279 PSV Pax2 Gly-Gaba n = 43, 280 NLL-po Pax7 Gaba n = 17, 297 CU-ECU Pax2 Gly-Gaba n = 15, 313 CBX Purkinje Gaba n = 346. All box plots include the median line, the box denotes the interquartile range (IQR), whiskers denote the rest of the data distribution, and outliers are denoted by points greater than ± 1.5× IQR. (e) The transcriptomic taxonomy tree of 338 subclasses organized in a dendrogram (same as Fig. 1a). From left to right, the bar plots represent neurotransmitter (NT) type assignment, heat map showing expression of major neurotransmitter marker genes, sex distribution, platform distribution, light-dark distribution of profiled cells, and number of donors that contributed to each subclass.

