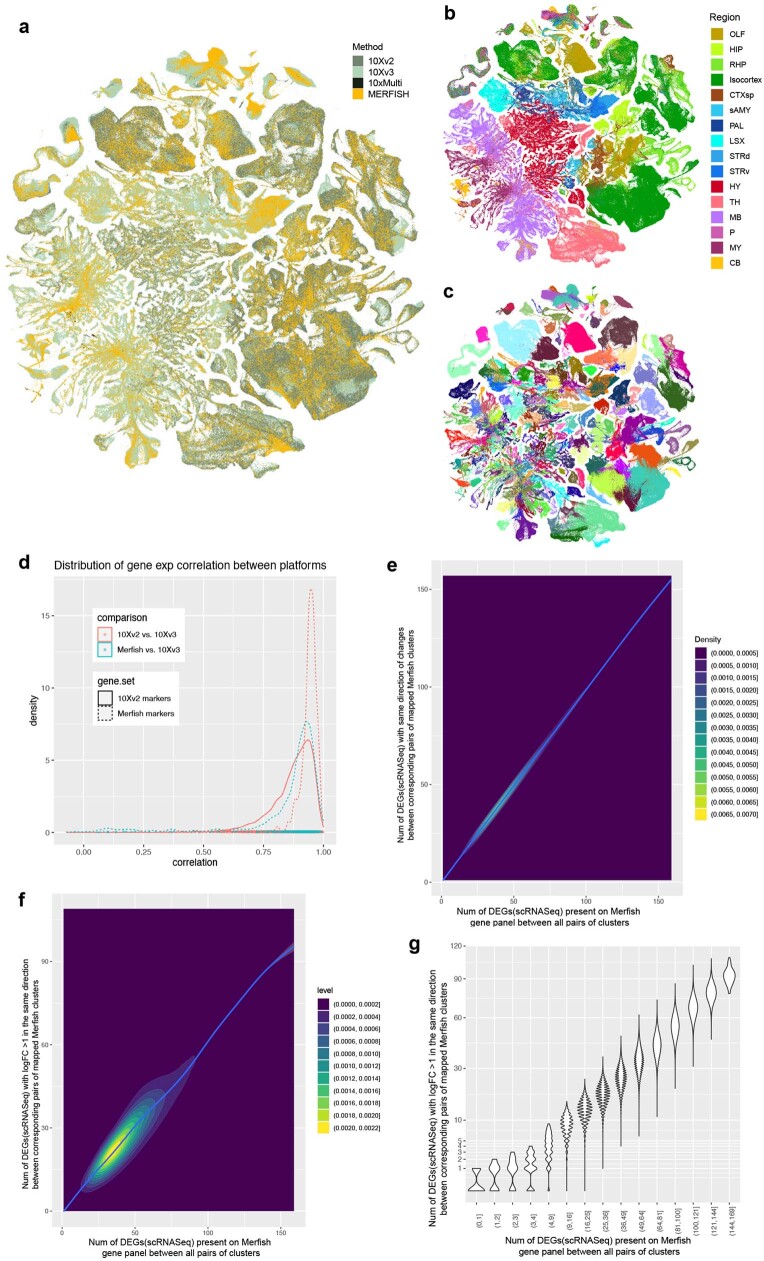
Extended Data Fig. 7. Validation of data integration across 10xv2, 10xv3, and MERFISH datasets.
(a-c) UMAP representation of all cell types colored by profiling platform (a), region (b), and subclass (c). Other than the regions only profiled by 10xv3 (LSX, STR, sAMY, PAL, Pons, MY), the cells from both 10xv2 and 10xv3 platforms integrate very well. Cell types in isocortex and HPF have a lot more 10xv2 cells, consistent with our sampling plan. For cell types/clusters containing many cells, we observed separation of 10xv2 and 10xv3 data in the UMAP space, but not at the cluster level. (d) Correlation of gene expression between 10xv2 and 10xv3 and between 10xv3 and MERFISH. For each gene, we computed the Pearson correlation of its average expression in each cluster across clusters between 10xv2 and 10xv3, and the correlation between 10xv3 and MERFISH. For 10xv3 and MERFISH comparison, distribution of the correlation values of all 500 genes in the MERFISH panel is shown. For 10xv3 and 10xv2 comparison, we show the correlation of 5383 marker genes based on 10xv2, and 466 10xv2 marker genes that are also present on the MERFISH gene panel (the other 34 MERFISH genes not shown have low expression in 10xv2 clusters). We manually inspected several genes with poor correlation and found them to have poor gene annotation or show relatively small variations across clusters. Most genes with low correlations between 10xv3 and MERFISH data are *Rik genes that are more likely to be poorly annotated, and the MERFISH probes selected for them might not work well. (e) 2D density plot showing on the X-axis the number of DEGs (based on 10xv3 dataset) present on the MERFISH gene panel between all pairs of clusters, and on the Y-axis the number of such DEGs showing the same direction of changes between corresponding pairs of mapped MERFISH clusters. Almost all the DEGs between all pairs of clusters show the same direction of changes between 10xv3 and MERFISH. (f) 2D density plot showing on the X-axis the number of DEGs (based on 10xv3 dataset) present on the MERFISH gene panel between all pairs of clusters, and on the Y-axis the number of such DEGs showing the same direction of changes, and |log2(FC)| > 1 between corresponding pairs of mapped MERFISH clusters. About 60% of DEGs between all pairs of clusters based on 10xv3 show significant fold change (FC) in MERFISH. (g) Similar analysis as in (f) but shown as violin plot by binning the number of 10xv3 DEGs present on the MERFISH gene panel on the X-axis, with better resolution on closely related pairs with four or fewer DEGs present on MERFISH gene panels. The MERFISH dataset can resolve the vast majority of clusters due to strong correlation of DEG expression between 10xv3 and MERFISH clusters. On the other hand, a few hundred pairs of clusters with fewer than two DEGs on the MERFISH gene panel remain unresolvable in the MERFISH data, and they are usually sibling clusters with indistinguishable spatial distribution.

