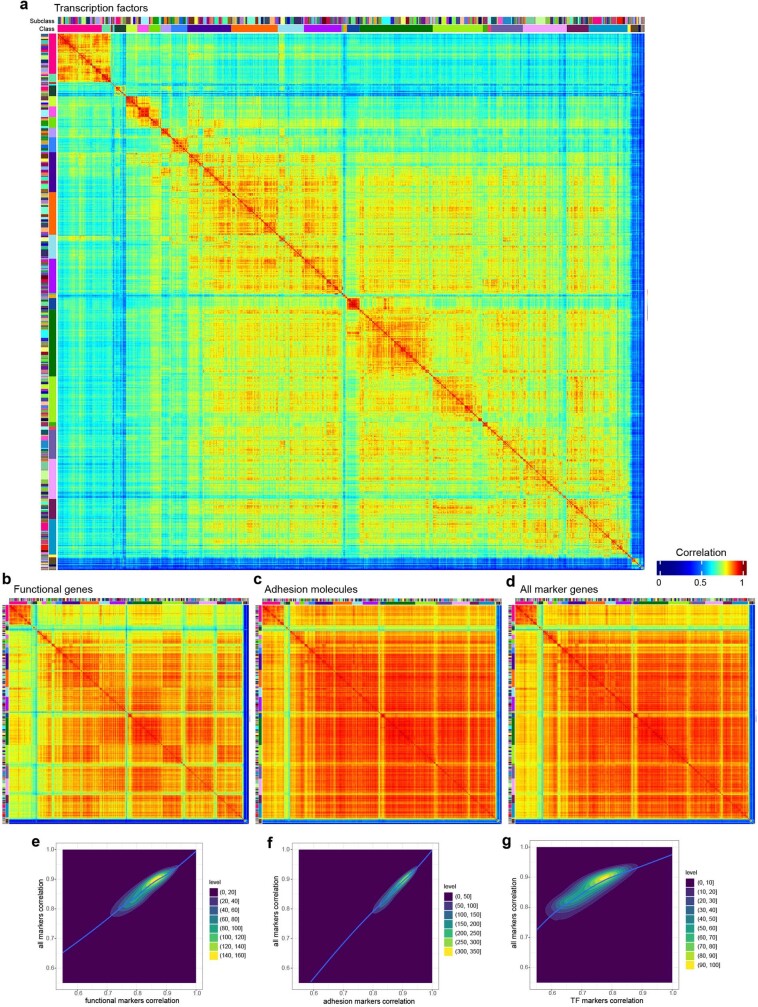
Extended Data Fig. 3. Marker gene expression correlation matrices showing relatedness among cell types.
(a-d) Heatmaps showing pairwise Pearson correlation of gene expression levels for each pair of clusters using marker gene sets of 534 transcription factors (a), 541 functional genes (including neuropeptides, GPCRs, ion channels, transporters, etc.) (b), 857 adhesion molecules (c), and all 8,460 marker genes (d). Correlations were computed using 10xv3 scRNA-seq data only except for the 31 nuclei-dominated clusters where 10xMulti snRNA-seq data were used. (e-g) All marker gene expression correlation between clusters compared to correlation between clusters of expression of functional marker genes (e), adhesion marker genes (f), and transcription factor (TF) marker genes (g). Correlation values are derived from a-d.

