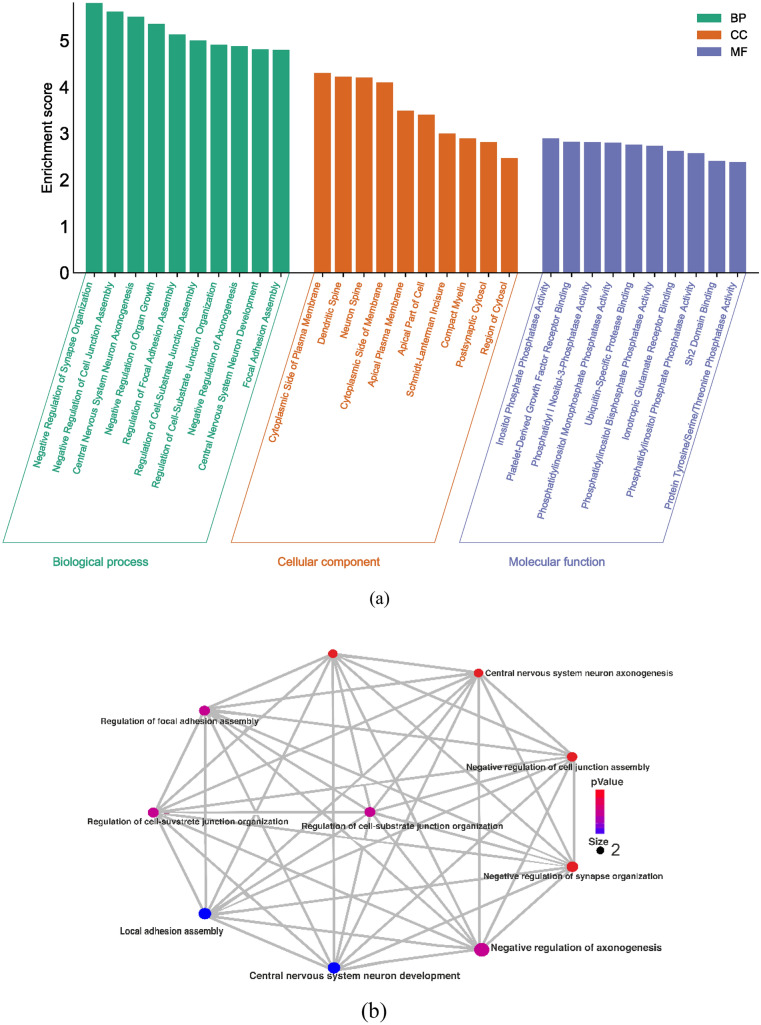
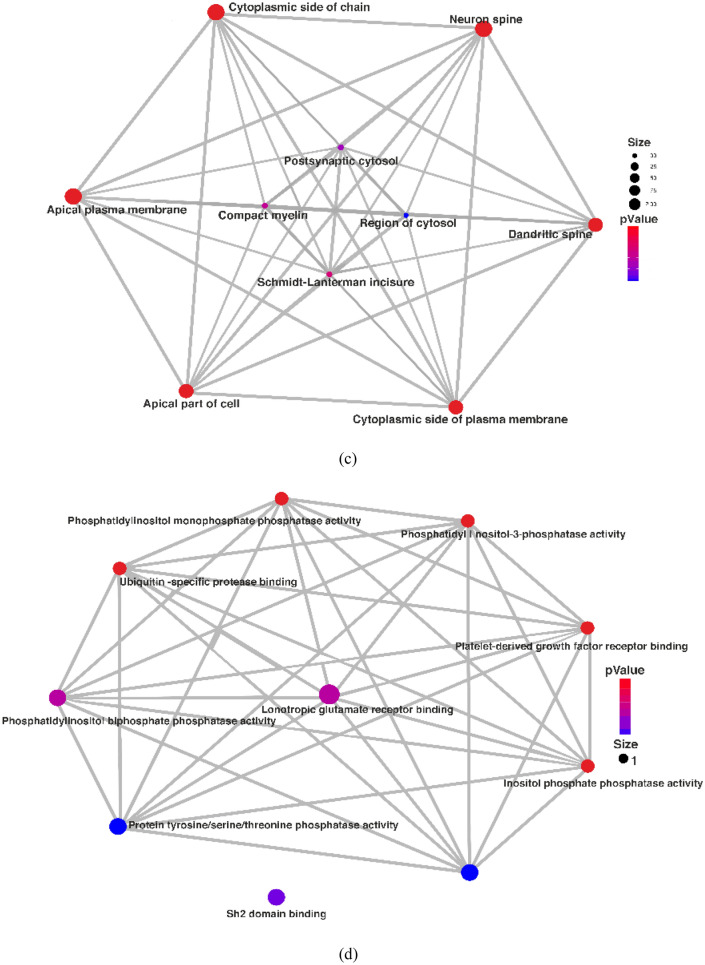
Fig. 2.
a Graphical representation of gene ontology enrichment analysis of genes, b represents the enrichment analysis of genes in the biological process by network interaction, c represents the enrichment analysis of genes in cellular component by network interaction, d represents the enrichment analysis of genes in molecular function by network interaction


