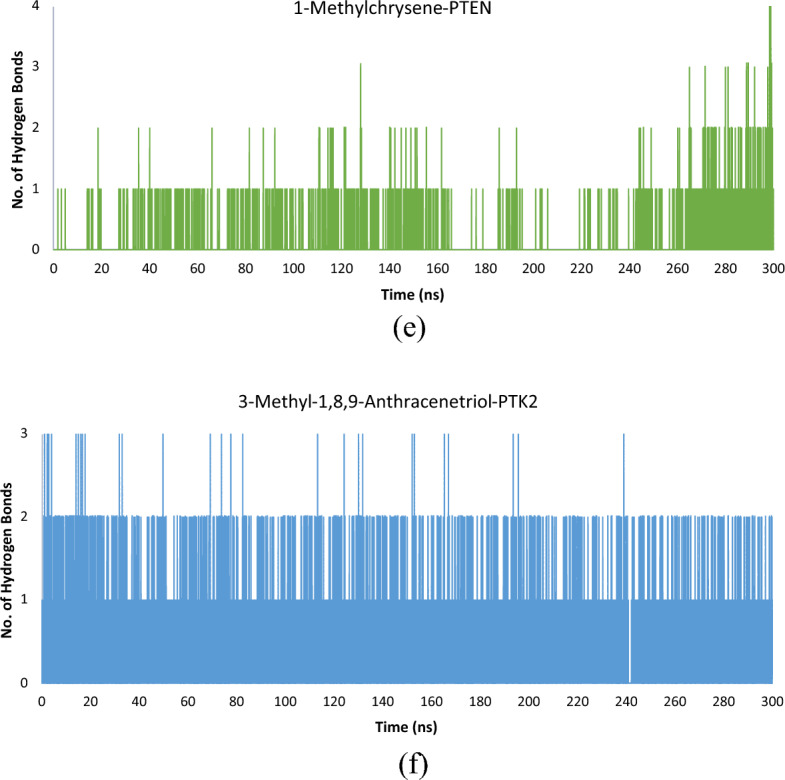
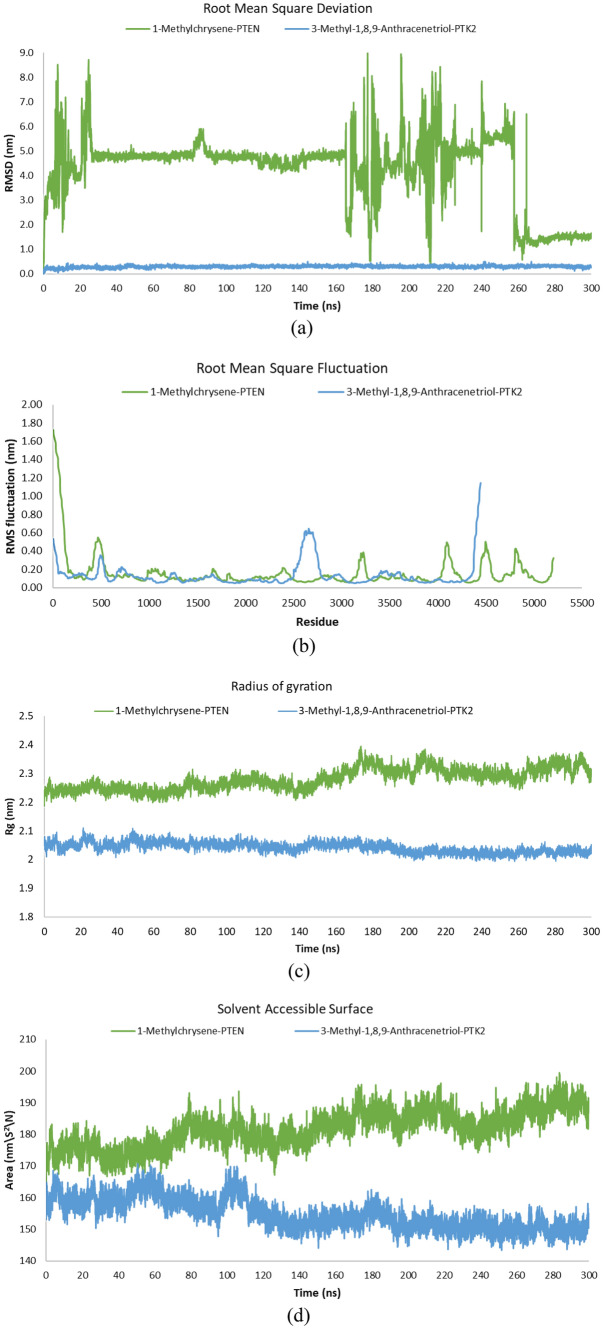
Fig. 5.

a–f Molecular dynamics simulations endpoints are shown as a root mean square deviation (RMSD), b root mean square fluctuation (RMSF), c radius of gyration (total and around axes), d solvent accessible surface, and e hydrogen bond number of complex 1-methylchrysene with Human Phosphatase and Tensin homolog (PTEN), f hydrogen bond number of complex 3-methyl-1,8,9-anthracenetriol with Focal Adhesion Kinase 1 (PTK2)

