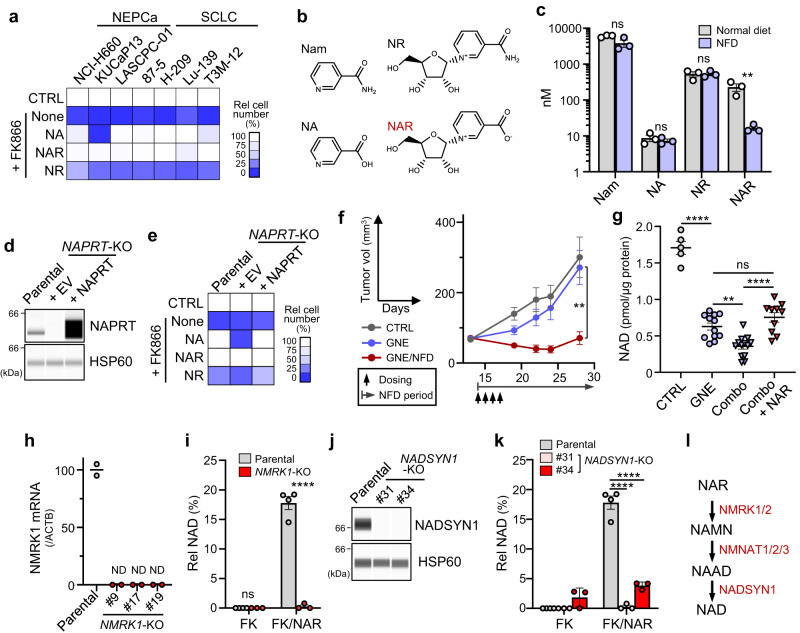
Fig. 6. Niacin restriction lowers blood NAR and restricts NAMPT-independent NAD synthesis in tumor cells.
a Effects of 10 μM exogenous niacin (NA, NAR or NR) on growth suppression by FK866 in indicated cultured cells. b Structures of niacin molecules found in mouse serum. c Serum levels of niacin molecules shown in (b) in mice fed a normal diet or NFD for 3 days. n = 3 mice (both groups). P = 0.0721 (Nam); P = 0.5360 (NA); P = 0.9509 (NR); P = 0.0180 (NAR). d NAPRT knock-out and rescue. NAPRT was knocked out in 87-5 cells, and one KO clone was transduced with either an NAPRT expression vector or empty vector (EV). The blot shown is representative of >2 independent experiments. e Effects of exogenous niacin on growth suppression by FK866 in cells or the clone in (d). f Growth curves of NAPRT-KO 87-5 xenograft tumors treated as in Fig. 5. n = 6 (CTRL) or 8 (GNE and GNE/NFD) tumors. P = 0.0067 (GNE vs GNE/NFD, day 28). g NAD levels of Lu-139 tumors in mice treated either as in Fig. 5 or with Combo + NAR. Combo: “GNE + NFD”. Each symbol represents one tumor. n = 5 (CTRL), 12 (GNE), 13 (Combo) or 10 (Combo + NAR) tumors. P < 0.0001 (CTRL vs GNE); P = 0.0022 (GNE vs combo); P = 0.3450 (GNE vs Combo + NAR); P <0.0001 (Combo vs Combo + NAR). h qRT-PCR analyses of NMRK1 in parental and NMRK1 knock-out 87-5 clones. Shown are mean values from two duplicate measures. ND not detectable. i NAD levels in parental and NMRK1-KO cells. Parental cells were assessed as four biological replicates. KO clones, each represented by a symbol, are the three independent clones shown in (h). FK, FK866. P<0.0001 (Parental vs NMRK1-KO, FK/NAR). j Immunoassays of NADSYN1-KO 87-5 clones. Shown is representative analysis of two assays. k NAD levels in NADSYN1-KO cells. Parental cell levels are the same as those shown in (i). Also shown are results of two independent KO clones, each with three biological replicates. P <0.0001 (Parental vs #31, FK/NAR); P<0.0001 (Parental vs #34, FK/NAR). l NAD synthesis pathway from NAR. Data are presented as the mean plus SEM (c, f, g, i, k). **P<0.01, ****P<0.0001 as determined by one-way ANOVA with a post hoc test (g, k) or by two-tailed t test (c, f, i). ns not significant. Source data are provided as a Source Data file.

