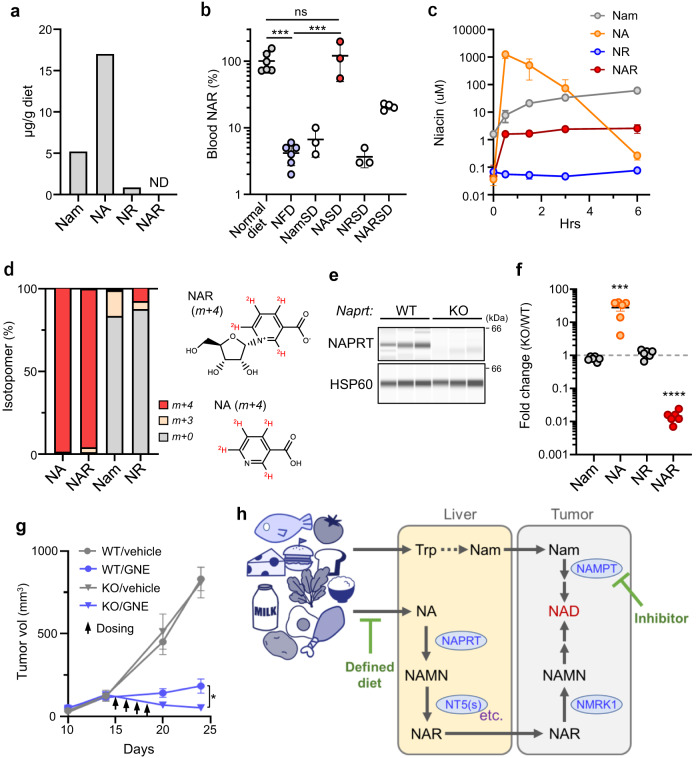
Fig. 7. Blood NAR is derived from dietary NA, NAPRT-dependently.
a Amounts of indicated niacin molecules found in the normal diet used for mice experiments. ND not detectable. Shown are averages of >2 technical replicates. b Effects of niacin supplementation of NFD on mouse serum NAR levels. n = 6 (normal diet and NFD), 4 (NARSD) or 3 (all others) mice. P = 0.0002 (Normal diet vs NFD); P = 0.9188 (Normal diet vs NASD); P = 0.0002 (NFD vs NASD). c Effects of NA administration (by gavage) on serum niacin levels. n = 3 (0, 1.5 and 6 h) or 4 (0.5 and 3 h) mice per time point. d Levels of labeled and unlabeled niacin molecules in serum of mice administered deuterium-labeled NA ([D4]-NA). Data is from an average of five mice. NAR (m+4) structure derived from [D4]-NA (m+4) is also shown. e NAPRT expression in liver of WT and Naprt-KO mice. n = 3 mice for each genotype. f Effects of Naprt-deficiency on serum levels of niacin molecules. n = 6 mice per genotype. P = 0.0003 (NA); P <0.0001 (NAR). g Effects of host Naprt-deficiency on NAMPTi therapeutic efficacy. NaprtWT;Rag1-/- or Naprt-/-;Rag1-/- mice were inoculated with A2780 cells and treated with GNE-617. n = 6 (WT/vehicle KO/vehicle), 7 (KO/GNE) or 8 (WT/GNE) tumors. P = 0.0136 (WT/GNE vs KO/GNE, day 24). h Proposed model of how systemic niacin metabolism modulates efficacy of NAMPT-targeted therapy. Data are presented as mean (d) or the mean plus SEM (b, c, f, g). *P <0.05, ***P < 0.001, ****P <0.0001 as determined by one-way ANOVA with a post hoc test (b) or by two-tailed t test (f, g). ns not significant. Source data are provided as a Source Data file.

