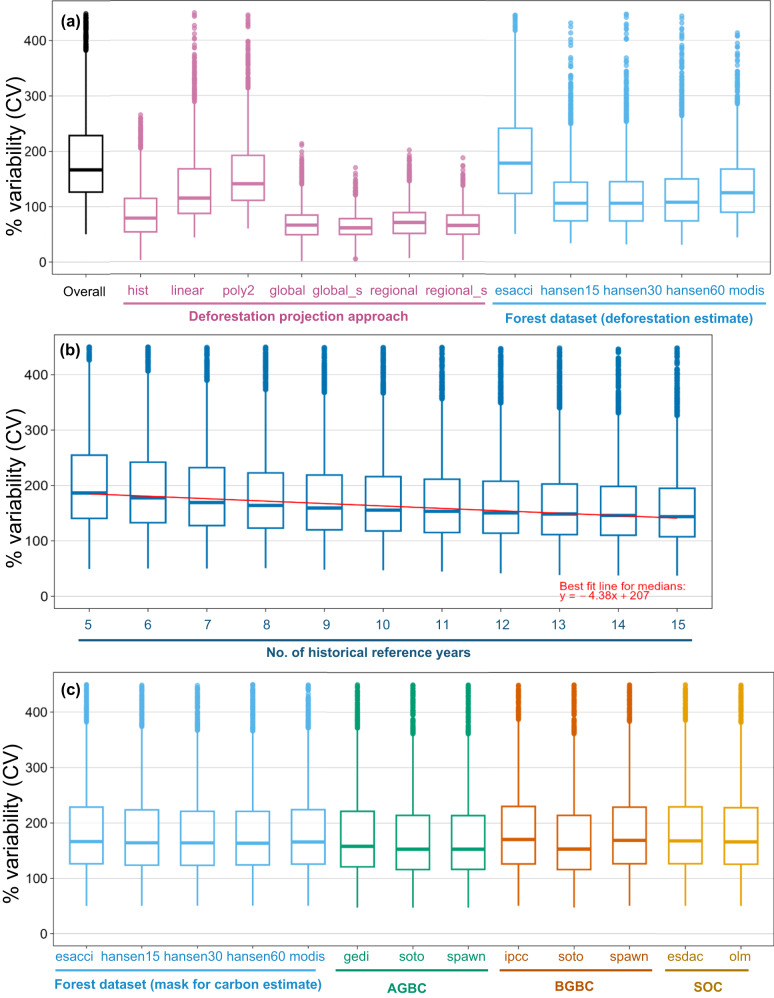
Fig. 2. Relative variability of deforestation emission baseline components.
Box plots showing distribution of relative variabilities (% CV) of deforestation emission baselines (each point represents one jurisdiction, for n = 2794 jurisdictions) for different component parameters (see explanation of these datasets and methods in Method section): a Overall relative variability (across all methods), relative variability for each deforestation projection approach, as well as for each forest dataset used for deforestation projection estimates. Note that hist is a simple historical average, linear and poly2 are time functions; global, global_s, regional, and regional_s are linear regression models. b Relative variability for each of the 5–15 possible lengths of historical reference periods used for deforestation projection estimates. c Relative variability for each forest dataset used for carbon estimates, as well as each AGBC, BGBC, and SOC dataset.

