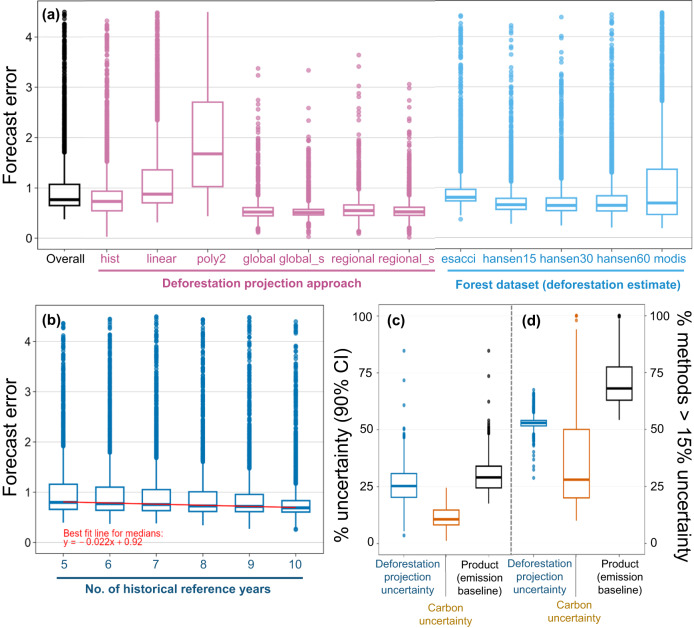
Fig. 4. Jurisdictional forecast error and uncertainty in deforestation emission baselines.
Box plots showing distribution of jurisdictional forecast error a, b of deforestation emission baselines (each point represents one jurisdiction, for n = 2,794 jurisdictions) for different component parameters (see explanation of these datasets and methods in Method section), as well as jurisdictional median relative uncertainty (90% CI) for carbon estimation, deforestation projection model, and propagated uncertainty for the deforestation emission baseline c, and the % of methods with > 15% uncertainty d.

