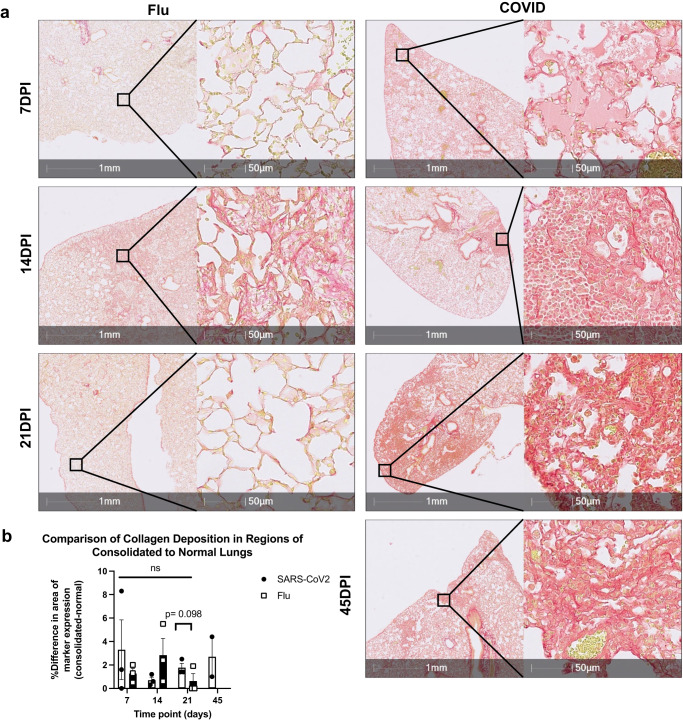
Fig. 5. Collagen deposited in Flu mouse model and COVID mouse model.
a Representative image of PSR stainings showing collagen deposition in lungs of SARS-CoV-2-infected K18 mice (IN, 1 × 10⁴ TCID50) at 7 (n = 3), 14 (n = 3), 21 (n = 3) and 45 DPI (n = 2) and Flu infected mice at 7 (n = 3), 14 (n = 4) and 21 DPI (n = 3) (50 PFU). b Quantification of collagen deposition in regions of consolidated and normal SARS-CoV-2-infected and Flu-infected lungs as detailed in Supplementary Fig. 7. Data are shown as mean ± SEM. Two-way analysis of variance (ANOVA) was used to compare collagen deposition level changes from 7 DPI to 21–45 DPI. One-tailed unpaired Student’s t test was performed to test the difference between two groups at one time point.

