Figure 6.
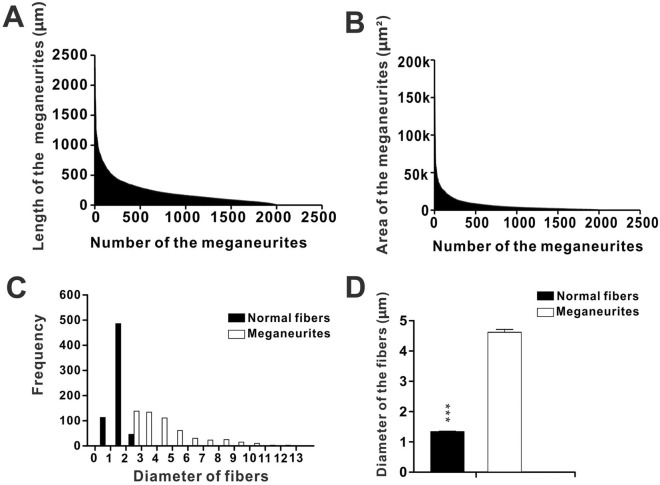
Charts showing length (A) and area (B) of the NADPH-d positive megaloneurites in the sacral spinal cord of aged dogs (2000 megaloneurites counted). (C) Histogram of diameter distribution of NADPH-d positive fibers. (D) The diameter of the megaloneurites (500 NADPH-d megaloneurites counted) and normal fibers (500 fibers counted). The k of unit label in (B) represents 1000, and asterisks in horizontal bars indicate statistically significant comparisons (***p < 0.001).

